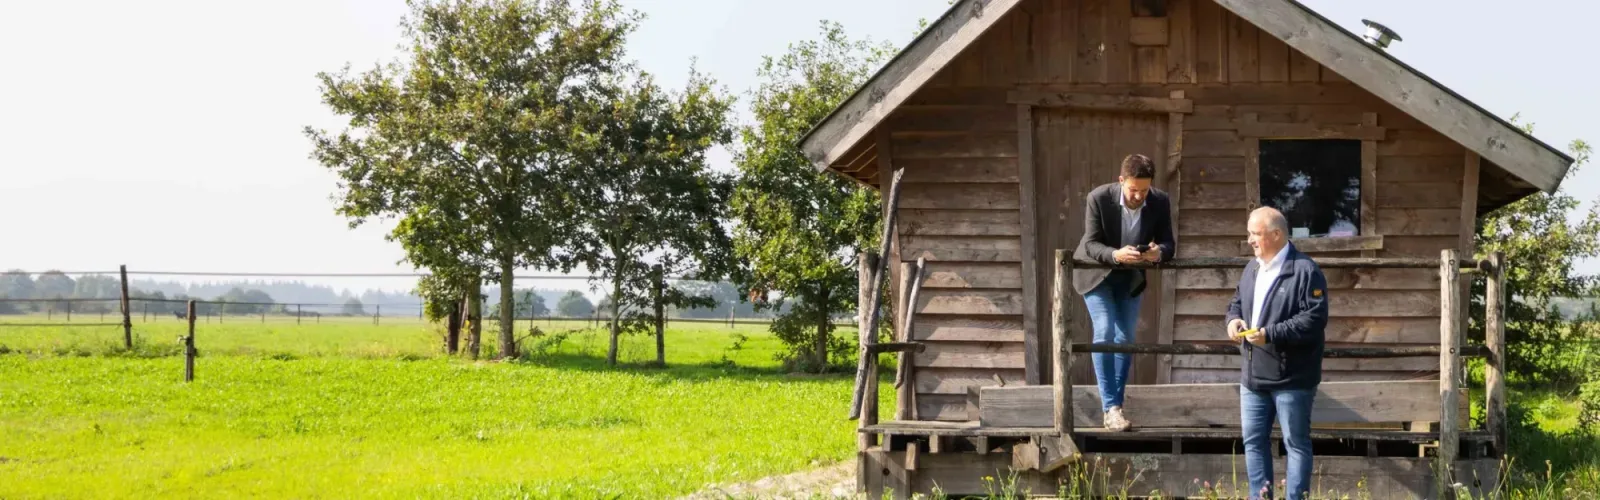

Erdman Makelaardij Hypotheken en Verzekeringen
"Personally, accessible and engaged realtor!"

Erdman Makelaardij Hypotheken en Verzekeringen staat voor persoonlijk advies en betrokkenheid. Onze dienstverlening is gericht op zowel particulieren als zakelijke klanten, met aandacht voor woningverkoop, -aankoop en -verhuur. Daarnaast bieden we taxaties en financieel advies aan, zowel voor woningen als bedrijfsruimtes. Ons werkgebied strekt zich uit van gemeente Westerwolde tot Stadskanaal en Emmen. Buiten kantoortijden zijn we voor...
Current housing stock
-

- Available
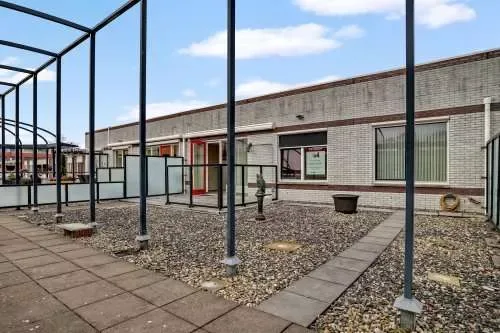
Zandberg 8
9563PH Ter Apelkanaal
€ 239.000 k.k.
Save as favorite- Living area
- 83 m²
- Land area
- 553 m²
- Bedrooms
- 3
-
- Available
Bentlagestraat 18
9561HB Ter Apel
€ 425.000 k.k.
€ 3.220/m²
CSave as favorite- Living area
- 132 m²
- Land area
- 450 m²
- Bedrooms
- 5
-

- Available
Beek 28
9406GV Assen
€ 369.500 k.k.
€ 2.480/m²
Save as favorite- Living area
- 149 m²
- Land area
- 220 m²
- Bedrooms
- 4
-
- Available
Bereklauw 10
7891DC Klazienaveen
€ 325.000 k.k.
BSave as favorite- Living area
- 93 m²
- Land area
- 231 m²
- Bedrooms
- 4
-

- Available
Heembadweg 33
9561CS Ter Apel
€ 249.500 k.k.
€ 2.061/m²
Save as favorite- Living area
- 121 m²
- Land area
- 154 m²
- Bedrooms
- 4
-

- Available
Balingerbrink 146
7812SM Emmen
€ 209.000 k.k.
€ 2.200/m²
Save as favorite- Living area
- 95 m²
- Land area
- 136 m²
- Bedrooms
- 4
Reviews (92)
Review platforms
BronscoresTotal score
92 total reviews

Funda
24 reviews on Funda

68 reviews on Google
-
Hoofdstraat 45 a
10Deskundig advies, altijd bereikbaar, vriendelijke mensen en alle ontvangen van potentiële kopers zeer netjes behandeld
-
heleen buntjer
10Goed en deskundig advies bij het verstrekken van een hypotheek/bouwdepot.
-
Tineke Meijering
8Goeie hulp bij de verkoop en aankoop nieuwe woning en vooral bij de administratie. Goede uitleg
-
Marjolijn Vissering
10Vriendelijk, eerlijk en zeer ervaren
-
Stadshart 60
9Er werd altijd snel op vragen gereageerd en de wensen van ons werden meegenomen. Deskundig en eerlijkheid zijn woorden die hier passen
-
Beetserweg 100
10Het contact verliep vanaf het begin goed. Er zijn veel contactmomenten over het in de verkoop krijgen van de woning, maar ook na bezichtigingen en de biedingen. Ook bij de notaris is de makelaar mee geweest en toonde zich daarmee zeer betrokken bij de verkoop. Ook voor vragen van onze kant stond de deur altijd open en kregen we duidelijke, deskundige antwoorden.
-
Markeweg 171
10De communicatie verliep erg goed. Ik werd goed op de hoogte gehouden en geïnformeerd. Deskundige begeleiding in verkoopproces.
-
Vledderdiep 46
10De inschatting van de uiteindelijke verkoopprijs is voorzichtig bepaald om geen verwachtingen te scheppen. En ik ben ervan overtuigd dat door de kennis van de markt dit ook de enige juiste benadering is. Wel werd de ingeschatte verkoopprijs iets overschreden. Wederom kennis van de markt Het contact was altijd vriendelijk, accuraat en helder. Ook na de verkoop van de woning werden we heel goed bijgestaan door de makelaar. Dit omdat er wat onenigheid was met kopers over, in hun o…
-
Fikri Cinar
10 -
Erwin Haijema
10Translated by AIShort lines, concrete and they provide clarity. Top service.
-
Ria Potze
10 -
Drentse Mondenweg 12
9Translated by AIDaniel has good communication regarding the sale of our house. Additionally, he is also happy to help with information regarding a new purchase.
-
Egbert
10 -
Tirza Dol
10Translated by AIReally well assisted in the search for a home of my own. From the first conversation it was immediately clear that no guarantees could be given about the duration of the search. Always spoken to kindly and neatly. Staff are skilled in their profession and helped me well with making the various choices, including a mortgage but also different insurances. There was always room for questions and reflection on the choices. They also thought along well with the different choices. The atmosphere is pleasant, you are greeted upon arrival and coffee or tea is always offered. Thank you for the help and advice!
-
marielle helweg
10 -
Havenstraat 33
10Translated by AIVery nice and good contact. I was kept informed of everything that was going to happen. I could ask questions and received clear answers.
-
Sellingerstraat 21
10Translated by AIGreat realtor really very satisfied Really personal guidance and the viewings were also very good Only praise
-
Plataanlaan 8
10Translated by AIThese people at this office simply know what customer service is and are also very good at providing guidance when you sell a house.
-
Henk mobiel
2Translated by AICalled on Tuesday, with the assurance that an appointment would be scheduled for a viewing, sent another SMS on Friday just to see if it had slipped through the cracks, no response received. Apparently, Erdman company is doing so well that they can simply ignore potential home buyers. We will skip this one in our search for a property. Received absolutely no reaction afterwards, not even a 'sorry, something went wrong'.
-
Esmee ter Veen
10Translated by AIVery satisfied with the sale of our current home and arranging the mortgage for the new home!