
Residents
25.700
Last year: 2025
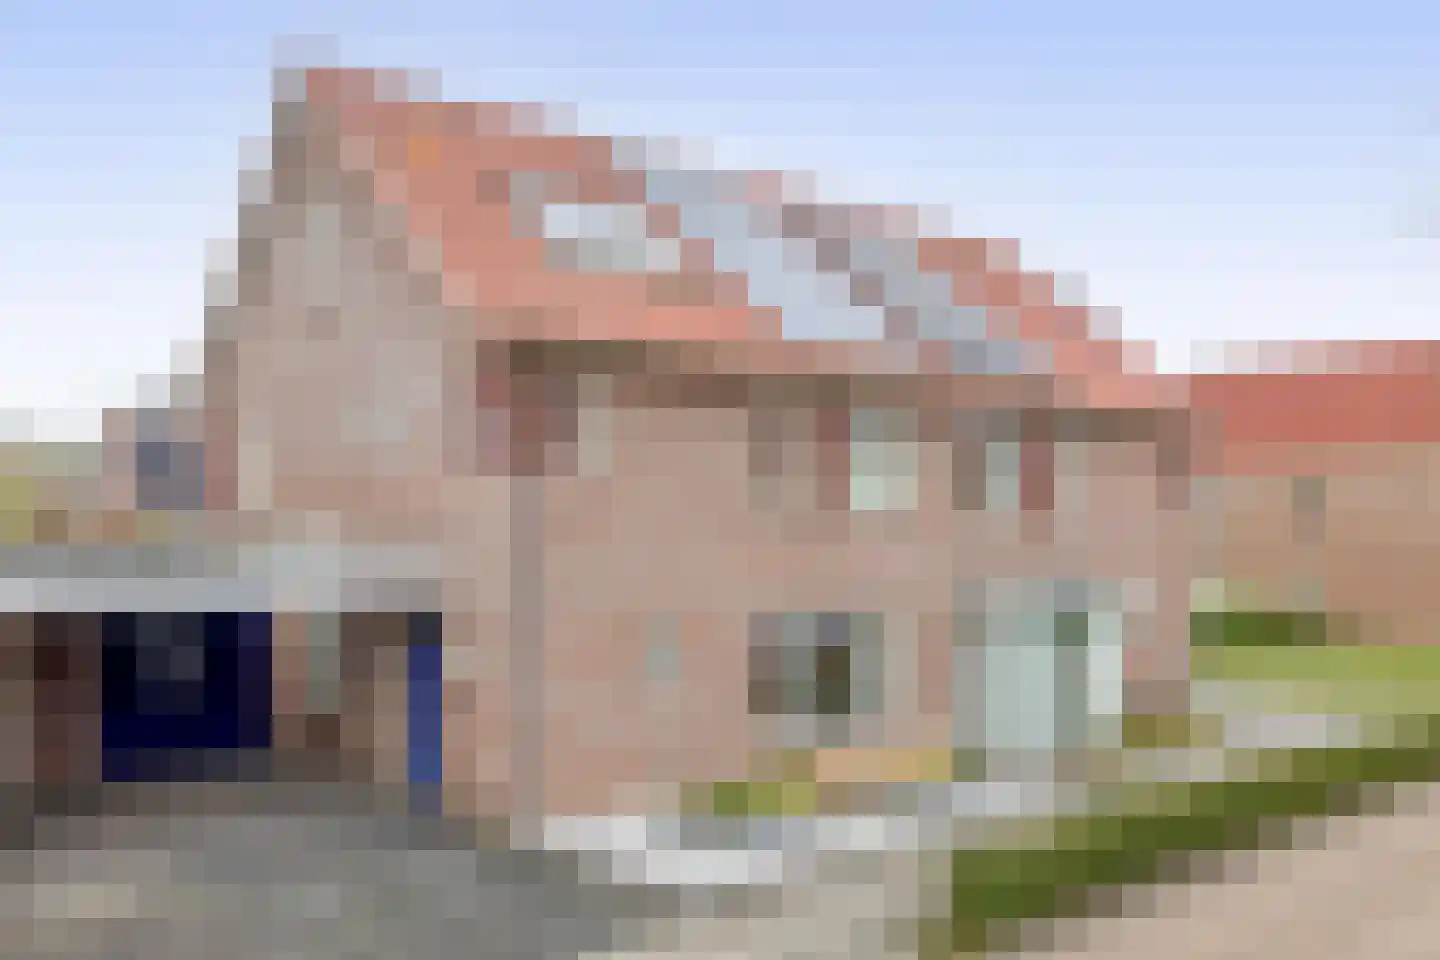
5751WV Deurne • Noord-Brabant
€ 399.500 k.k.
Cost of copper (estimated): € 9.840
2% transfer tax (€ 7.990) + notary (€ 1.150) + valuation (€ 700)
Total incl. VAT: € 409.340
Purchase price /m²: € 3.026
For this property, no detailed description is available yet.
€ 399.500
Cost of copper (estimated): € 9.840
2% transfer tax (€ 7.990) + notary (€ 1.150) + valuation (€ 700)
Total purchase (incl. p.p.): € 409.340
2,78%
Yearly
€ 19.975
Direct available
Estimated mortgage
Indicative gross monthly cost
Based on annuity and 30 year term
Indicative net monthly cost
iDisclaimer: this mortgage calculation is a simplified indication based on general assumptions. No rights can be derived from the results shown. Calculated with 10-annual interest (met NHG), automatically determined based on the price limit € 470.000. Source: 10-jaars rente uit mortgage_rates (25-04-2026 04:00).
Ligbad, toilet, wastafel, en wastafelmeubel
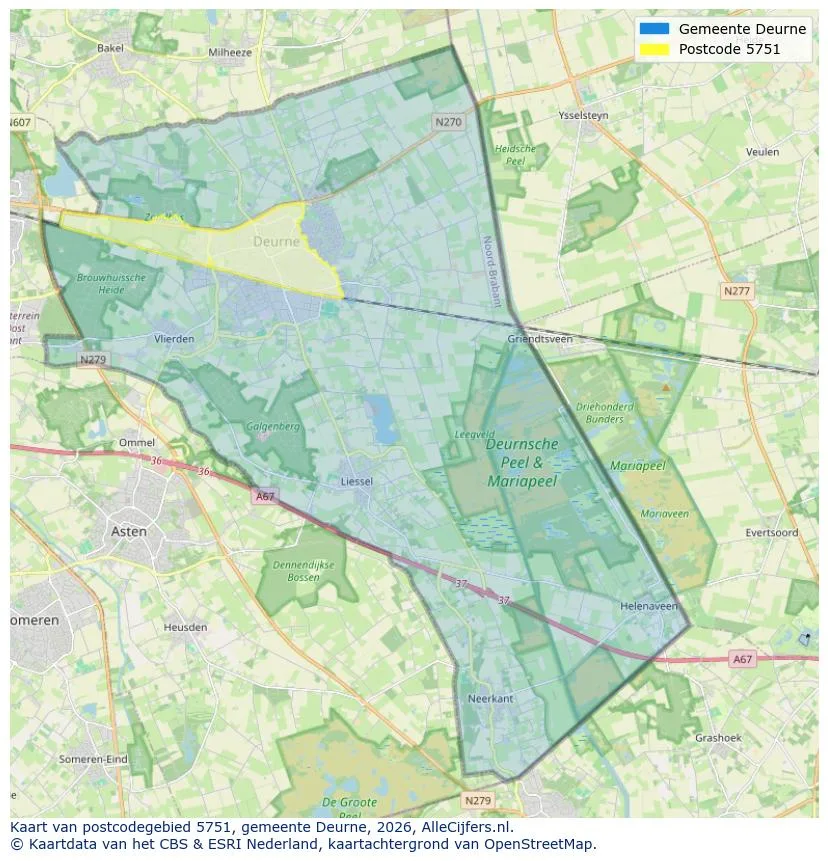
Discover where agents are active in Deurne
View current location data on residents, WOZ development, housing stock, energy consumption, business activity and safety in Deurne. In 2025 were there 25.700 residents. The average WOZ value in 2025 is EUR 417.996.
Residents
25.700
Last year: 2025
Average WOZ
EUR 417.996
Last year: 2025
Average income per person.
EUR 32.748
Source: AllNumbers
Crimes (current year)
801
Total registered
| Year | Residents |
|---|---|
| 2021 | 25.014 |
| 2022 | 25.163 |
| 2023 | 25.539 |
| 2024 | 25.550 |
| 2025 | 25.700 |
| Year | Average WOZ |
|---|---|
| 2021 | EUR 300.000 |
| 2022 | EUR 335.000 |
| 2023 | EUR 380.000 |
| 2024 | EUR 388.289 |
| 2025 | EUR 417.996 |
Hoger
4.780
Praktisch
5.350
Middelbaar
8.760
Europa
1.805
Nederland
21.940
Buiten Europa
1.955
Label C
3.034
Label A
2.545
Label B
2.336
Label D
1.088
Label F
635
Label G
422
Label E
327
Label A+
306
Label A+++
297
Label A++++
152
Label A++
135
Label A+++++
9
| Year | Gas (m3) | Electricity (kWh) |
|---|---|---|
| 2020 | 1.350 | 3.220 |
| 2021 | 1.520 | 3.230 |
| 2022 | 1.180 | 3.000 |
| 2023 | 970 | 2.830 |
| 2024 | 938 | 2.899 |
Hoekwoning
Gas: 900 • Electricity: 2.560
Huurwoning
Gas: 720 • Electricity: 2.180
Koopwoning
Gas: 1.110 • Electricity: 3.210
Appartement
Gas: 570 • Electricity: 1.970
Tussenwoning
Gas: 790 • Electricity: 2.440
Vrijstaande woning
Gas: 1.460 • Electricity: 4.030
Twee-onder-één-kap woning
Gas: 1.060 • Electricity: 2.960
Total number of company establishments: 3.355
| Period | Crimes |
|---|---|
| jan 2025 | 77 |
| jan 2026 | 68 |
| jul 2025 | 61 |
| jun 2025 | 76 |
| mei 2025 | 58 |
| mrt 2025 | 75 |
| nov 2024 | 85 |
| nov 2025 | 64 |
| okt 2024 | 85 |
| okt 2025 | 55 |
| sep 2024 | 65 |
| sep 2025 | 68 |
These figures give an indicative picture of safety trends in the living environment of Deurne.
Short answers based on current local statistics, handy for a quick comparison of the living environment.
Deurne telt in 2025 ongeveer 25.700 inwoners.
De gemiddelde WOZ-waarde in Deurne is in 2025 circa € 417.996.
Het gemiddelde inkomen per inwoner in Deurne ligt rond € 32.748 per jaar.
Voor het huidige jaar gaat het om ongeveer 801 geregistreerde misdrijven. Gebruik deze cijfers als indicatie en vergelijk trends per periode.
In Deurne komt vooral "Tussenwoningen" veel voor, met ongeveer 3.380 woningen.
View more homes in this location.
5751BH Deurne
€ 430.000 k.k.
€ 4.886/m²

5751MV Deurne
€ 1.185 p/m
€ 9/m²
5754AK Deurne
€ 469.000 k.k.
5753BL Deurne
€ 444.400 k.k.

5754CZ Deurne
€ 439.000 k.k.
5753GH Deurne
€ 625.000 k.k.
5751SL Deurne
€ 595.013 k.k.
5751WL Deurne
€ 529.015 k.k.
