Residents
10.080
Last year: 2025
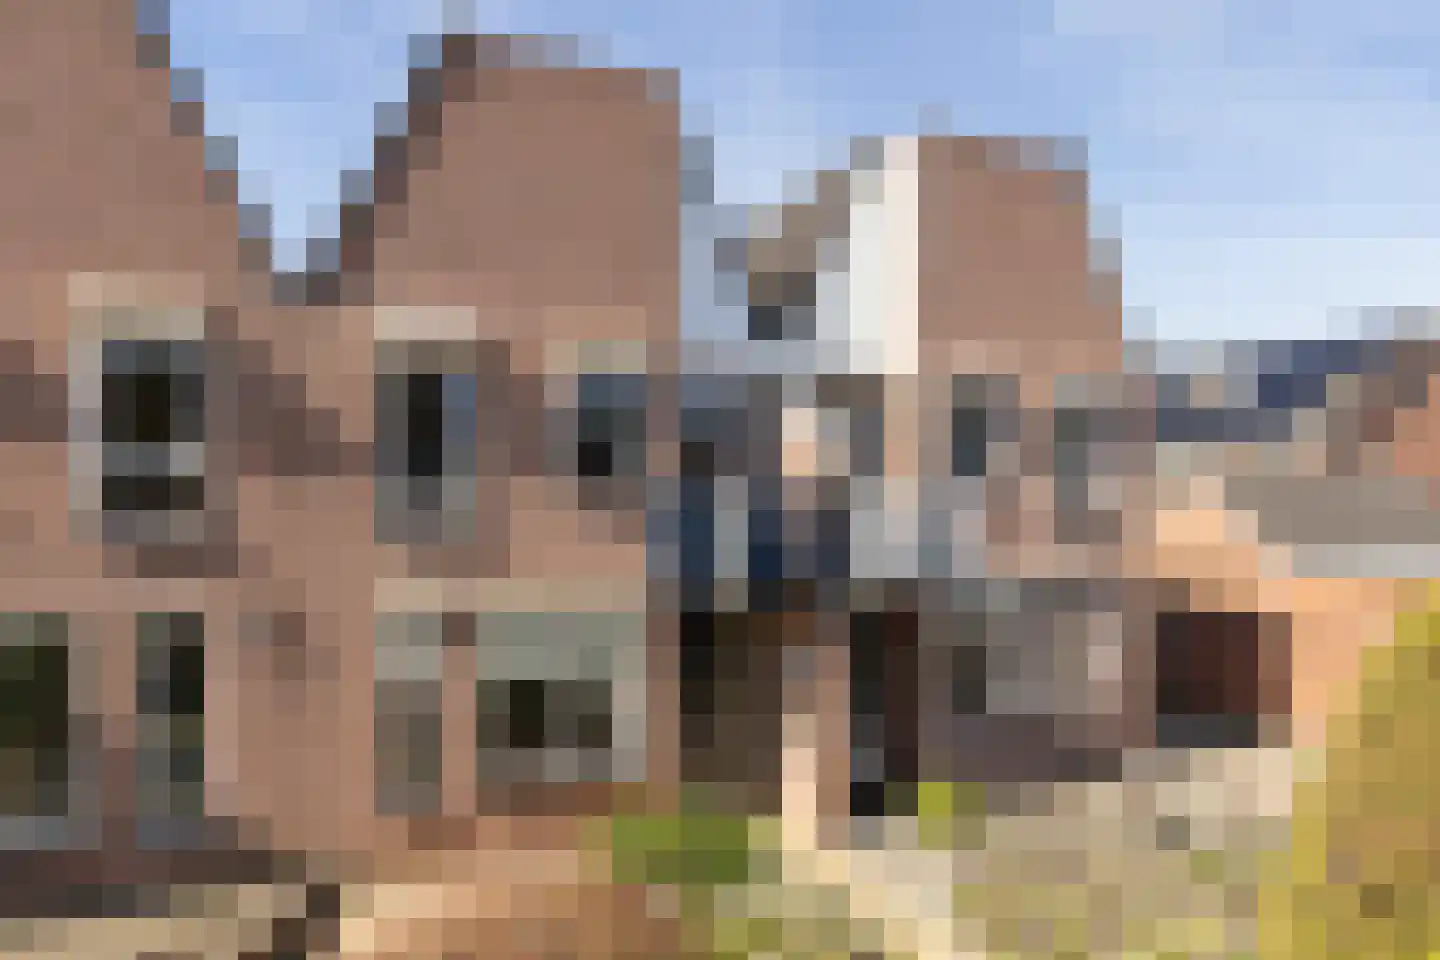
7141TK Groenlo • Gelderland

For this property, no detailed description is available yet.
€ 299.000
Cost of copper (estimated): € 7.830
2% transfer tax (€ 5.980) + notary (€ 1.150) + valuation (€ 700)
Total purchase (incl. p.p.): € 306.830
2,78%
Yearly
€ 14.950
Direct available
Estimated mortgage
Indicative gross monthly cost
Based on annuity and 30 year term
Indicative net monthly cost
iDisclaimer: this mortgage calculation is a simplified indication based on general assumptions. No rights can be derived from the results shown. Calculated with 10-annual interest (met NHG), automatically determined based on the price limit € 470.000. Source: 10-jaars rente uit mortgage_rates (29-04-2026 03:45).
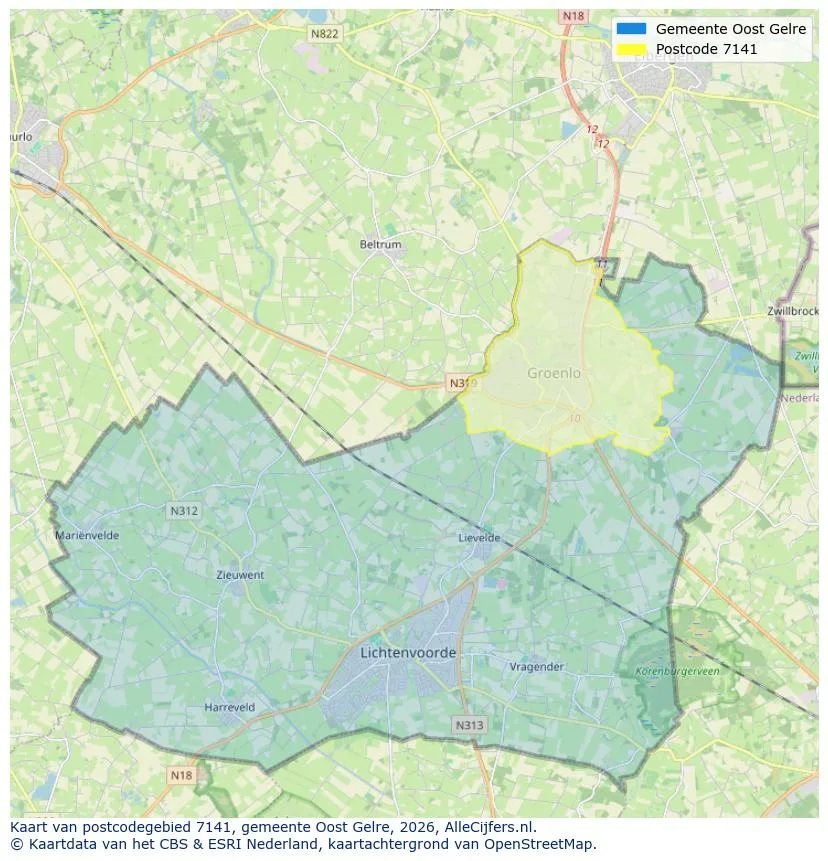
Spatial overview of the work area in Groenlo
View current location data on residents, WOZ development, housing stock, energy consumption, business activity and safety in Groenlo. In 2025 were there 10.080 residents. The average WOZ value in 2025 is EUR 314.000.
Residents
10.080
Last year: 2025
Average WOZ
EUR 314.000
Last year: 2025
Average income per person.
EUR 33.200
Source: AllNumbers
Crimes (current year)
207
Total registered
| Year | Residents |
|---|---|
| 2021 | 9.860 |
| 2022 | 9.920 |
| 2023 | 10.030 |
| 2024 | 10.075 |
| 2025 | 10.080 |
| Year | Average WOZ |
|---|---|
| 2021 | EUR 222.000 |
| 2022 | EUR 236.000 |
| 2023 | EUR 264.000 |
| 2024 | EUR 280.000 |
| 2025 | EUR 314.000 |
Hoger
2.320
Praktisch
1.750
Middelbaar
3.460
Europa
785
Nederland
8.650
Buiten Europa
645
Label C
1.391
Label A
1.002
Label B
856
Label D
532
Label G
372
Label F
361
Label E
289
Label A+++
54
Label A++
42
Label A+
28
Label A++++
13
Label A+++++
1
| Year | Gas (m3) | Electricity (kWh) |
|---|---|---|
| 2020 | 1.300 | 3.010 |
| 2021 | 1.450 | 3.040 |
| 2022 | 1.130 | 2.840 |
| 2023 | 930 | 2.730 |
| 2024 | 900 | 2.820 |
Hoekwoning
Gas: 910 • Electricity: 2.580
Huurwoning
Gas: 770 • Electricity: 2.050
Koopwoning
Gas: 980 • Electricity: 2.970
Appartement
Gas: 690 • Electricity: 1.960
Tussenwoning
Gas: 850 • Electricity: 2.450
Vrijstaande woning
Gas: 1.240 • Electricity: 3.850
Twee-onder-één-kap woning
Gas: 960 • Electricity: 2.870
Total number of company establishments: 1.120
| Period | Crimes |
|---|---|
| jan 2025 | 11 |
| jan 2026 | 14 |
| jul 2025 | 15 |
| jun 2025 | 14 |
| mei 2025 | 16 |
| mrt 2025 | 19 |
| nov 2024 | 23 |
| nov 2025 | 13 |
| okt 2024 | 20 |
| okt 2025 | 32 |
| sep 2024 | 22 |
| sep 2025 | 22 |
These figures give an indicative picture of safety trends in the living environment of Groenlo.
Short answers based on current local statistics, handy for a quick comparison of the living environment.
Groenlo telt in 2025 ongeveer 10.080 inwoners.
De gemiddelde WOZ-waarde in Groenlo is in 2025 circa € 314.000.
Het gemiddelde inkomen per inwoner in Groenlo ligt rond € 33.200 per jaar.
Voor het huidige jaar gaat het om ongeveer 207 geregistreerde misdrijven. Gebruik deze cijfers als indicatie en vergelijk trends per periode.
In Groenlo komt vooral "Tussenwoningen" veel voor, met ongeveer 1.247 woningen.
View more homes in this location.

7141VP Groenlo
€ 315.000 k.k.

7141ZR Groenlo
€ 349.000 k.k.
7141WB Groenlo
€ 259.000 k.k.

7141WK Groenlo
€ 259.053 k.k.

7141TV Groenlo
€ 250.000 k.k.

7141EE Groenlo
€ 682.500 k.k.
7141WH Groenlo
€ 349.080 k.k.

7141TC Groenlo
€ 1.545 p/m
€ 13/m²
