
Residents
168.946
Last year: 2026
2033RE Haarlem • Noord-Holland
€ 480.000 k.k.
Cost of copper (estimated): € 11.450
2% transfer tax (€ 9.600) + notary (€ 1.150) + valuation (€ 700)
Total incl. VAT: € 491.450
Purchase price /m²: € 6.154
Dit lichte en moderne appartement uit 2013 biedt ruimte, comfort en een fijne ligging in Haarlem, gelegen aan de Diepenbrockstraat 92. Met circa 78 m² woonoppervlak, twee slaapkamers en een zonnig balkon, is het ideaal voor gezinnen, stellen of ouderen. Het appartement heeft unieke uitzichten, energielabel A en nabijheid tot Albert Heijn XL en Reinaldapark met diverse activiteiten. Er zijn goede OV-verbindingen naar Amsterdam en Schiphol, waardoor het rustig en toegankelijk is. Buiten een open keuken die naadloos aan de woonkamer schakelt, heeft het een praktisch toegankelijke indeling met ruime berging voor extra opslag en fietsen. De directe omgeving biedt diverse scholen, winkels en recreatieactiviteiten, inclusief Boerhaavebad en Grote Markt.
€ 480.000
Cost of copper (estimated): € 11.450
2% transfer tax (€ 9.600) + notary (€ 1.150) + valuation (€ 700)
Total purchase (incl. p.p.): € 491.450
3,04%
Yearly
€ 24.000
Direct available
Estimated mortgage
Indicative gross monthly cost
Based on annuity and 30 year term
Indicative net monthly cost
iDisclaimer: this mortgage calculation is a simplified indication based on general assumptions. No rights can be derived from the results shown. Calculated with 10-annual interest (zonder NHG), automatically determined based on the price limit € 470.000. Source: 10-jaars rente uit mortgage_rates (05-05-2026 03:45). For non-NHG, an 80% mortgage of the market value has been used in this indication.
Douche en wastafel
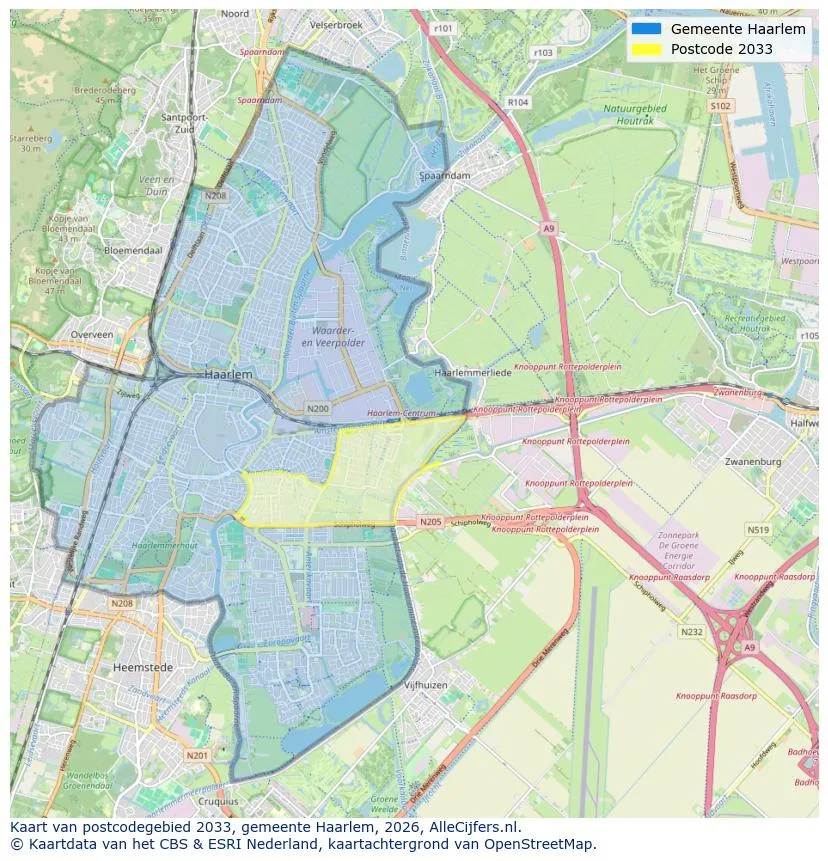
Spatial overview of the work area in Haarlem
View current location data on residents, WOZ development, housing stock, energy consumption, business activity and safety in Haarlem. In 2026 were there 168.946 residents. The average WOZ value in 2025 is EUR 505.000.
Residents
168.946
Last year: 2026
Average WOZ
EUR 505.000
Last year: 2025
Average income per person.
EUR 39.300
Source: AllNumbers
Crimes (current year)
9.383
Total registered
| Year | Residents |
|---|---|
| 2022 | 162.898 |
| 2023 | 165.396 |
| 2024 | 167.636 |
| 2025 | 168.743 |
| 2026 | 168.946 |
| Year | Average WOZ |
|---|---|
| 2021 | EUR 380.000 |
| 2022 | EUR 417.000 |
| 2023 | EUR 479.000 |
| 2024 | EUR 483.000 |
| 2025 | EUR 505.000 |
Hoger
45
Praktisch
22
Middelbaar
33
Europa
22.013
Nederland
105.573
Buiten Europa
41.157
Label C
16.311
Label A
16.043
Label F
11.811
Label G
10.233
Label B
8.296
Label E
8.020
Label D
7.483
Label A+++
1.955
Label A++
1.470
Label A+
1.442
Label A++++
138
Label A+++++
16
| Year | Gas (m3) | Electricity (kWh) |
|---|---|---|
| 2020 | 1.080 | 2.390 |
| 2021 | 1.220 | 2.450 |
| 2022 | 960 | 2.280 |
| 2023 | 840 | 2.140 |
| 2024 | 800 | 2.160 |
Hoekwoning
Gas: 1.110 • Electricity: 2.580
Huurwoning
Gas: 710 • Electricity: 1.800
Koopwoning
Gas: 950 • Electricity: 2.430
Appartement
Gas: 670 • Electricity: 1.800
Tussenwoning
Gas: 950 • Electricity: 2.400
Vrijstaande woning
Gas: 1.700 • Electricity: 4.040
Twee-onder-één-kap woning
Gas: 1.480 • Electricity: 3.310
Total number of company establishments: 28.865
| Period | Crimes |
|---|---|
| jan 2025 | 720 |
| jan 2026 | 752 |
| jul 2025 | 814 |
| jun 2025 | 842 |
| mei 2025 | 894 |
| mrt 2025 | 813 |
| nov 2024 | 773 |
| nov 2025 | 709 |
| okt 2024 | 880 |
| okt 2025 | 776 |
| sep 2024 | 777 |
| sep 2025 | 800 |
These figures give an indicative picture of safety trends in the living environment of Haarlem.
Short answers based on current local statistics, handy for a quick comparison of the living environment.
Haarlem telt in 2026 ongeveer 168.946 inwoners.
De gemiddelde WOZ-waarde in Haarlem is in 2025 circa € 505.000.
Het gemiddelde inkomen per inwoner in Haarlem ligt rond € 39.300 per jaar.
Voor het huidige jaar gaat het om ongeveer 9.383 geregistreerde misdrijven. Gebruik deze cijfers als indicatie en vergelijk trends per periode.
In Haarlem komt vooral "Appartementen" veel voor, met ongeveer 46.092 woningen.
View more homes in this location.

2012JR Haarlem
€ 1.050.000 k.k.

2012SG Haarlem
€ 1.585.000 k.k.

2023EA Haarlem
€ 1.250.000 k.k.
2036BE Haarlem
€ 500.000 k.k.
2023WX Haarlem
€ 450.000 k.k.

2034ST Haarlem
€ 425.000 k.k.
2024JV Haarlem
€ 399.000 k.k.
2024GG Haarlem
€ 800.000 k.k.
€ 6.957/m²
