
Residents
3.790
Last year: 2025
For this property, no detailed description is available yet.
Discover where agents are active in Heerjansdam
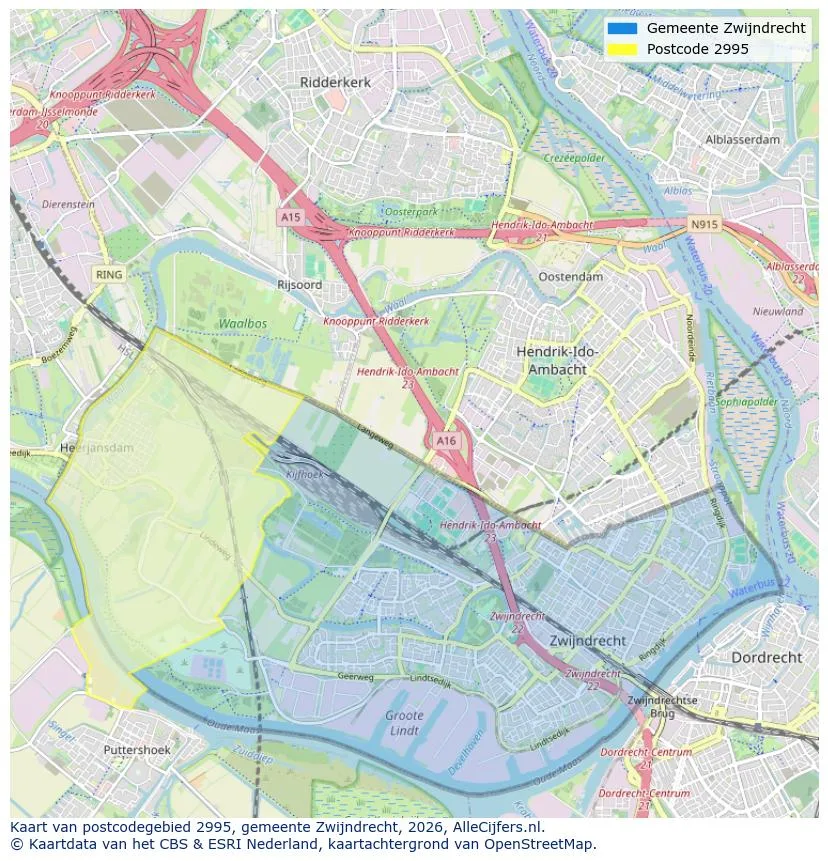
View current location data on residents, WOZ development, housing stock, energy consumption, business activity and safety in Heerjansdam. In 2025 were there 3.790 residents. The average WOZ value in 2025 is EUR 432.846.
Residents
3.790
Last year: 2025
Average WOZ
EUR 432.846
Last year: 2025
Average income per person.
EUR 32.774
Source: AllNumbers
Crimes (current year)
72
Total registered
| Year | Residents |
|---|---|
| 2021 | 3.805 |
| 2022 | 3.820 |
| 2023 | 3.825 |
| 2024 | 3.820 |
| 2025 | 3.790 |
| Year | Average WOZ |
|---|---|
| 2021 | EUR 309.341 |
| 2022 | EUR 330.364 |
| 2023 | EUR 386.745 |
| 2024 | EUR 404.387 |
| 2025 | EUR 432.846 |
Hoger
760
Praktisch
780
Middelbaar
1.300
Europa
155
Nederland
3.375
Buiten Europa
255
Label A
506
Label C
333
Label B
229
Label E
191
Label D
152
Label F
131
Label G
117
Label A+
70
Label A++++
19
Label A+++
9
Label A++
3
Label A+++++
0
| Year | Gas (m3) | Electricity (kWh) |
|---|---|---|
| 2020 | 1.258 | 2.960 |
| 2021 | 1.401 | 3.059 |
| 2022 | 1.041 | 2.824 |
| 2023 | 888 | 2.609 |
| 2024 | 873 | 2.624 |
Hoekwoning
Gas: 989 • Electricity: 2.727
Huurwoning
Gas: 703 • Electricity: 1.862
Koopwoning
Gas: 1.006 • Electricity: 3.030
Appartement
Gas: 511 • Electricity: 1.648
Tussenwoning
Gas: 819 • Electricity: 2.426
Vrijstaande woning
Gas: 1.478 • Electricity: 3.997
Twee-onder-één-kap woning
Gas: 1.066 • Electricity: 3.314
Total number of company establishments: 500
| Period | Crimes |
|---|---|
| jan 2025 | 8 |
| jan 2026 | 6 |
| jul 2025 | 8 |
| jun 2025 | 3 |
| mei 2025 | 6 |
| mrt 2025 | 3 |
| nov 2024 | 1 |
| nov 2025 | 4 |
| okt 2024 | 3 |
| okt 2025 | 6 |
| sep 2024 | 7 |
| sep 2025 | 10 |
These figures give an indicative picture of safety trends in the living environment of Heerjansdam.
Short answers based on current local statistics, handy for a quick comparison of the living environment.
Heerjansdam telt in 2025 ongeveer 3.790 inwoners.
De gemiddelde WOZ-waarde in Heerjansdam is in 2025 circa € 432.846.
Het gemiddelde inkomen per inwoner in Heerjansdam ligt rond € 32.774 per jaar.
Voor het huidige jaar gaat het om ongeveer 72 geregistreerde misdrijven. Gebruik deze cijfers als indicatie en vergelijk trends per periode.
In Heerjansdam komt vooral "Tussenwoningen" veel voor, met ongeveer 681 woningen.
View more homes in this location.

2995BH Heerjansdam
€ 325.000 k.k.

2995TN Heerjansdam
€ 749.500 k.k.
€ 5.721/m²

2995VN Heerjansdam
€ 795.000 k.k.
€ 6.023/m²

2995VN Heerjansdam
€ 700.000 k.k.
€ 7.000/m²

2995AT Heerjansdam
€ 580.000 k.k.
€ 7.250/m²

2995AA Heerjansdam
€ 375.000 k.k.
€ 5.769/m²

2995TK Heerjansdam
Price upon request

2995XL Heerjansdam
€ 469.000 k.k.
€ 5.270/m²
