
Residents
832
Last year: 2026
6261NZ Mheer • Limburg
€ 498.000 k.k.
Cost of copper (estimated): € 11.810
2% transfer tax (€ 9.960) + notary (€ 1.150) + valuation (€ 700)
Total incl. VAT: € 509.810
Purchase price /m²: € 3.000
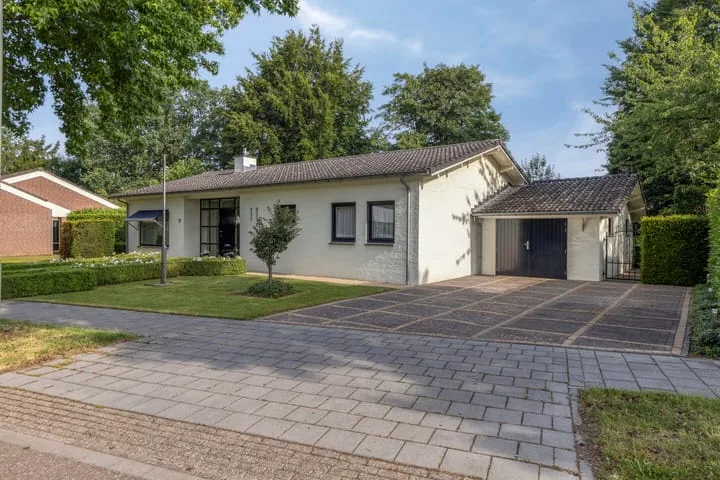
Burgemeester Beckersweg 53 in Mheer biedt woninggelegenheid in een historisch pand uit 1903 dat vroeger dienst deed als gemeentehuis en politiebureau. Het huidige huis heeft circa 837 m³ totaalinhoud, waarvan de woonruimte 166 m² beslaat met drie ruime slaapkamers, een uitgebreide woon- en eetkamer met uitzicht op de prachtige tuin. De woning bevat veel historische elementen zoals de mergelmuur in de voortuin en heeft verwarmingsinstallaties van 2021. Het huis staat gesitueerd in het dorp Mheer, nabij Maastricht, met toegang tot prachtig natuurgebied en uitstekende verbindingen via busverbinding en de snelweg A2.
€ 498.000
Cost of copper (estimated): € 11.810
2% transfer tax (€ 9.960) + notary (€ 1.150) + valuation (€ 700)
Total purchase (incl. p.p.): € 509.810
3,04%
Yearly
€ 24.900
Direct available
Estimated mortgage
Indicative gross monthly cost
Based on annuity and 30 year term
Indicative net monthly cost
iDisclaimer: this mortgage calculation is a simplified indication based on general assumptions. No rights can be derived from the results shown. Calculated with 10-annual interest (zonder NHG), automatically determined based on the price limit € 470.000. Source: 10-jaars rente uit mortgage_rates (12-05-2026 03:45). For non-NHG, an 80% mortgage of the market value has been used in this indication.
Douche, dubbele wastafel, ligbad, en toilet
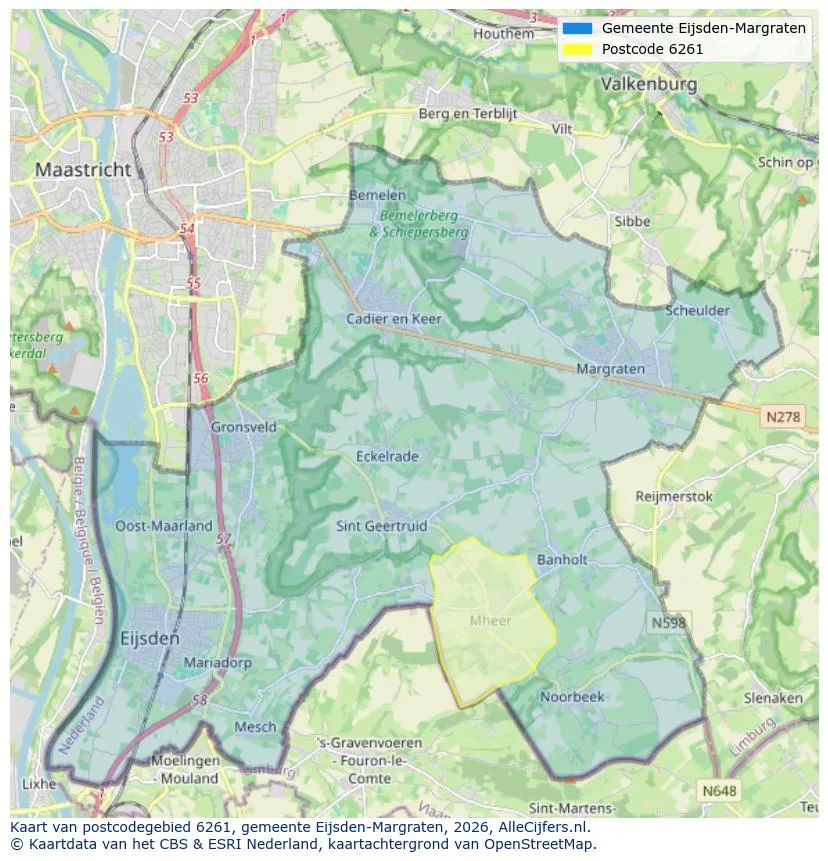
Discover where agents are active in Mheer
View current location data on residents, WOZ development, housing stock, energy consumption, business activity and safety in Mheer. In 2026 were there 832 residents. The average WOZ value in 2025 is EUR 437.000.
Residents
832
Last year: 2026
Average WOZ
EUR 437.000
Last year: 2025
Average income per person.
EUR 38.100
Source: AllNumbers
Crimes (current year)
5
Total registered
| Year | Residents |
|---|---|
| 2021 | 855 |
| 2022 | 865 |
| 2023 | 845 |
| 2024 | 840 |
| 2025 | 835 |
| 2026 | 832 |
| Year | Average WOZ |
|---|---|
| 2021 | EUR 315.000 |
| 2022 | EUR 332.000 |
| 2023 | EUR 395.000 |
| 2024 | EUR 405.000 |
| 2025 | EUR 437.000 |
Hoger
260
Praktisch
100
Middelbaar
260
Europa
90
Nederland
720
Buiten Europa
30
Label C
97
Label G
77
Label D
70
Label B
62
Label F
46
Label A
44
Label E
13
Label A+
3
Label A++
1
Label A+++
0
Label A++++
0
Label A+++++
0
| Year | Gas (m3) | Electricity (kWh) |
|---|---|---|
| 2020 | 1.780 | 3.290 |
| 2021 | 2.030 | 3.340 |
| 2022 | 1.620 | 3.160 |
| 2023 | 1.330 | 3.020 |
| 2024 | 1.310 | 3.140 |
Hoekwoning
Gas: 1.190 • Electricity: 2.580
Huurwoning
Gas: 1.130 • Electricity: 2.540
Koopwoning
Gas: 1.380 • Electricity: 3.140
Appartement
Gas: 1.200 • Electricity: 2.510
Tussenwoning
Gas: 1.150 • Electricity: 2.810
Vrijstaande woning
Gas: 1.570 • Electricity: 3.560
Twee-onder-één-kap woning
Gas: 1.230 • Electricity: 2.780
Total number of company establishments: 135
| Period | Crimes |
|---|---|
| jan 2026 | 1 |
| jul 2025 | 0 |
| jun 2025 | 0 |
| mei 2025 | 0 |
| mrt 2025 | 1 |
| mrt 2026 | 1 |
| nov 2024 | 0 |
| nov 2025 | 0 |
| okt 2024 | 3 |
| okt 2025 | 1 |
| sep 2024 | 0 |
| sep 2025 | 0 |
These figures give an indicative picture of safety trends in the living environment of Mheer.
Short answers based on current local statistics, handy for a quick comparison of the living environment.
Mheer telt in 2026 ongeveer 832 inwoners.
De gemiddelde WOZ-waarde in Mheer is in 2025 circa € 437.000.
Het gemiddelde inkomen per inwoner in Mheer ligt rond € 38.100 per jaar.
Voor het huidige jaar gaat het om ongeveer 5 geregistreerde misdrijven. Gebruik deze cijfers als indicatie en vergelijk trends per periode.
In Mheer komt vooral "Vrijstaande woningen" veel voor, met ongeveer 153 woningen.
View more homes in this location.

6261NV Mheer
€ 550.000 k.k.
€ 2.895/m²

6261PC Mheer
€ 449.000 k.k.
€ 2.993/m²

6261PH Mheer
€ 349.000 k.k.
€ 4.105/m²

6261PH Mheer
€ 399.000 k.k.
€ 3.439/m²

6261NH Mheer
€ 765.000 k.k.
€ 3.370/m²

6261NE Mheer
€ 650.000 k.k.
€ 0/m²
6261NM Mheer
€ 599.000 k.k.
€ 4.074/m²

6261NJ Mheer
€ 269.000 k.k.
€ 3.164/m²
