
Residents
6.455
Last year: 2025
5451VR Mill • Noord-Brabant
€ 425.000 k.k.
Cost of copper (estimated): € 10.350
2% transfer tax (€ 8.500) + notary (€ 1.150) + valuation (€ 700)
Total incl. VAT: € 435.350
For this property, no detailed description is available yet.
€ 425.000
Cost of copper (estimated): € 10.350
2% transfer tax (€ 8.500) + notary (€ 1.150) + valuation (€ 700)
Total purchase (incl. p.p.): € 435.350
2,78%
Yearly
€ 21.250
Direct available
Estimated mortgage
Indicative gross monthly cost
Based on annuity and 30 year term
Indicative net monthly cost
iDisclaimer: this mortgage calculation is a simplified indication based on general assumptions. No rights can be derived from the results shown. Calculated with 10-annual interest (met NHG), automatically determined based on the price limit € 470.000. Source: 10-jaars rente uit mortgage_rates (27-04-2026 04:00).
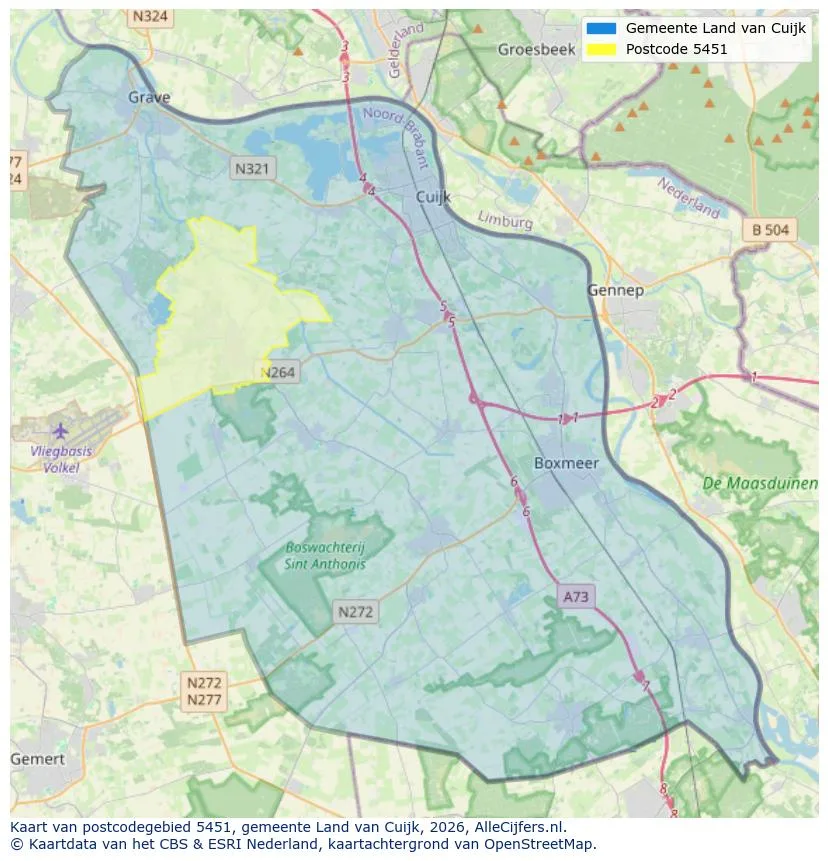
View the location and discover the brokers in this region
View current location data on residents, WOZ development, housing stock, energy consumption, business activity and safety in Mill. In 2025 were there 6.455 residents. The average WOZ value in 2025 is EUR 406.000.
Residents
6.455
Last year: 2025
Average WOZ
EUR 406.000
Last year: 2025
Average income per person.
EUR 33.200
Source: AllNumbers
Crimes (current year)
148
Total registered
| Year | Residents |
|---|---|
| 2021 | 6.215 |
| 2022 | 6.290 |
| 2023 | 6.330 |
| 2024 | 6.370 |
| 2025 | 6.455 |
| Year | Average WOZ |
|---|---|
| 2021 | EUR 284.000 |
| 2022 | EUR 317.000 |
| 2023 | EUR 361.000 |
| 2024 | EUR 387.000 |
| 2025 | EUR 406.000 |
Hoger
1.220
Praktisch
1.380
Middelbaar
2.220
Europa
300
Nederland
5.835
Buiten Europa
320
Label C
621
Label A
544
Label B
439
Label D
378
Label G
260
Label F
230
Label E
155
Label A+++
125
Label A++++
34
Label A+
33
Label A++
21
Label A+++++
1
| Year | Gas (m3) | Electricity (kWh) |
|---|---|---|
| 2020 | 1.450 | 3.400 |
| 2021 | 1.640 | 3.450 |
| 2022 | 1.270 | 3.250 |
| 2023 | 1.040 | 3.040 |
| 2024 | 1.010 | 3.100 |
Hoekwoning
Gas: 880 • Electricity: 2.640
Huurwoning
Gas: 780 • Electricity: 2.190
Koopwoning
Gas: 1.170 • Electricity: 3.460
Appartement
Gas: 620 • Electricity: 1.960
Tussenwoning
Gas: 830 • Electricity: 2.420
Vrijstaande woning
Gas: 1.400 • Electricity: 4.010
Twee-onder-één-kap woning
Gas: 1.070 • Electricity: 3.090
Total number of company establishments: 935
| Period | Crimes |
|---|---|
| jan 2025 | 11 |
| jan 2026 | 11 |
| jul 2025 | 10 |
| jun 2025 | 7 |
| mei 2025 | 15 |
| mrt 2025 | 21 |
| nov 2024 | 20 |
| nov 2025 | 12 |
| okt 2024 | 15 |
| okt 2025 | 11 |
| sep 2024 | 22 |
| sep 2025 | 16 |
These figures give an indicative picture of safety trends in the living environment of Mill.
Short answers based on current local statistics, handy for a quick comparison of the living environment.
Mill telt in 2025 ongeveer 6.455 inwoners.
De gemiddelde WOZ-waarde in Mill is in 2025 circa € 406.000.
Het gemiddelde inkomen per inwoner in Mill ligt rond € 33.200 per jaar.
Voor het huidige jaar gaat het om ongeveer 148 geregistreerde misdrijven. Gebruik deze cijfers als indicatie en vergelijk trends per periode.
In Mill komt vooral "Vrijstaande woningen" veel voor, met ongeveer 967 woningen.
View more homes in this location.

5451GE Mill
€ 750.000 k.k.

5451AC Mill
€ 400.000 k.k.
€ 3.921/m²

5451HL Mill
€ 895.000 k.k.
€ 5.524/m²

5451JH Mill
€ 449.000 k.k.
€ 3.650/m²

5451HC Mill
Price upon request

5451AP Mill
€ 725.000 k.k.
€ 5.330/m²

5451WL Mill
€ 450.000 k.k.
€ 3.600/m²

5451AW Mill
€ 1.095.000 k.k.
€ 4.802/m²
