Residents
17.620
Last year: 2025
8332CN Steenwijk • Overijssel
€ 479.000 k.k.
Cost of copper (estimated): € 11.430
2% transfer tax (€ 9.580) + notary (€ 1.150) + valuation (€ 700)
Total incl. VAT: € 490.430
For this property, no detailed description is available yet.
€ 479.000
Cost of copper (estimated): € 11.430
2% transfer tax (€ 9.580) + notary (€ 1.150) + valuation (€ 700)
Total purchase (incl. p.p.): € 490.430
3,04%
Yearly
€ 23.950
Direct available
Estimated mortgage
Indicative gross monthly cost
Based on annuity and 30 year term
Indicative net monthly cost
iDisclaimer: this mortgage calculation is a simplified indication based on general assumptions. No rights can be derived from the results shown. Calculated with 10-annual interest (zonder NHG), automatically determined based on the price limit € 470.000. Source: 10-jaars rente uit mortgage_rates (26-04-2026 04:00). For non-NHG, an 80% mortgage of the market value has been used in this indication.
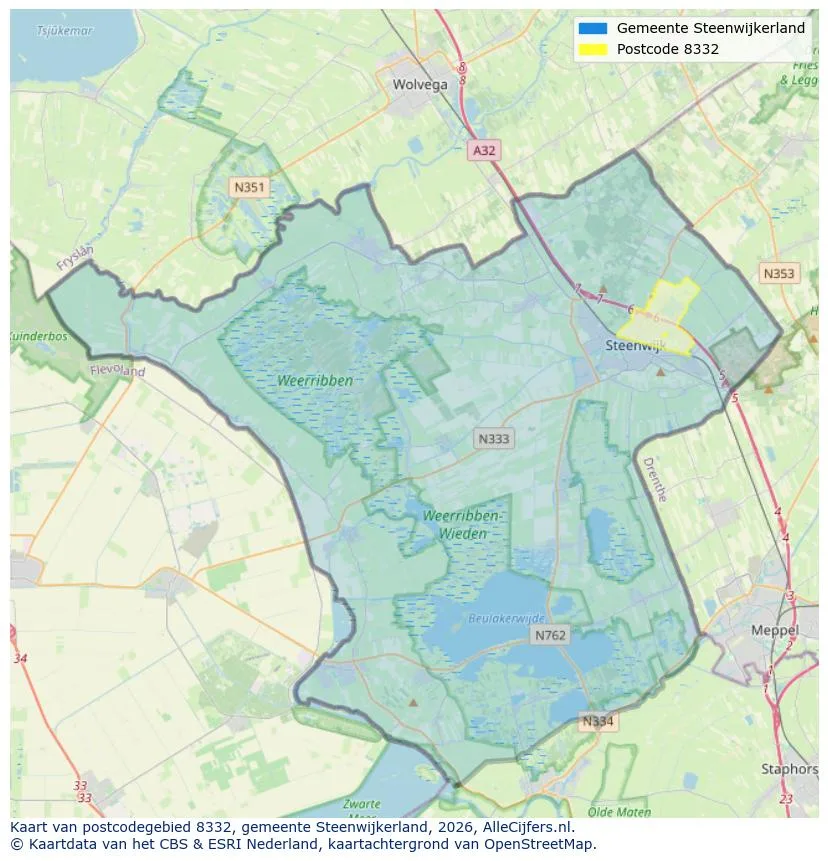
Explore Steenwijk and the surrounding areas
View current location data on residents, WOZ development, housing stock, energy consumption, business activity and safety in Steenwijk. In 2025 were there 17.620 residents. The average WOZ value in 2025 is EUR 286.000.
Residents
17.620
Last year: 2025
Average WOZ
EUR 286.000
Last year: 2025
Average income per person.
EUR 30.300
Source: AllNumbers
Crimes (current year)
752
Total registered
| Year | Residents |
|---|---|
| 2021 | 17.110 |
| 2022 | 17.200 |
| 2023 | 17.495 |
| 2024 | 17.515 |
| 2025 | 17.620 |
| Year | Average WOZ |
|---|---|
| 2021 | EUR 201.000 |
| 2022 | EUR 223.000 |
| 2023 | EUR 259.000 |
| 2024 | EUR 273.000 |
| 2025 | EUR 286.000 |
Hoger
3.430
Praktisch
3.610
Middelbaar
5.860
Europa
895
Nederland
14.700
Buiten Europa
2.015
Label A
2.392
Label C
2.334
Label B
1.559
Label D
683
Label G
582
Label F
405
Label E
336
Label A+++
214
Label A+
188
Label A++++
181
Label A++
131
Label A+++++
3
| Year | Gas (m3) | Electricity (kWh) |
|---|---|---|
| 2020 | 1.180 | 2.470 |
| 2021 | 1.340 | 2.530 |
| 2022 | 1.050 | 2.410 |
| 2023 | 870 | 2.310 |
| 2024 | 840 | 2.380 |
Hoekwoning
Gas: 960 • Electricity: 2.390
Huurwoning
Gas: 750 • Electricity: 1.840
Koopwoning
Gas: 980 • Electricity: 2.720
Appartement
Gas: 650 • Electricity: 1.670
Tussenwoning
Gas: 860 • Electricity: 2.220
Vrijstaande woning
Gas: 1.180 • Electricity: 3.540
Twee-onder-één-kap woning
Gas: 960 • Electricity: 2.610
Total number of company establishments: 1.950
| Period | Crimes |
|---|---|
| jan 2025 | 58 |
| jan 2026 | 49 |
| jul 2025 | 62 |
| jun 2025 | 66 |
| mei 2025 | 71 |
| mrt 2025 | 57 |
| nov 2024 | 56 |
| nov 2025 | 54 |
| okt 2024 | 45 |
| okt 2025 | 78 |
| sep 2024 | 57 |
| sep 2025 | 76 |
These figures give an indicative picture of safety trends in the living environment of Steenwijk.
Short answers based on current local statistics, handy for a quick comparison of the living environment.
Steenwijk telt in 2025 ongeveer 17.620 inwoners.
De gemiddelde WOZ-waarde in Steenwijk is in 2025 circa € 286.000.
Het gemiddelde inkomen per inwoner in Steenwijk ligt rond € 30.300 per jaar.
Voor het huidige jaar gaat het om ongeveer 752 geregistreerde misdrijven. Gebruik deze cijfers als indicatie en vergelijk trends per periode.
In Steenwijk komt vooral "Tussenwoningen" veel voor, met ongeveer 2.702 woningen.
View more homes in this location.

8332GT Steenwijk
€ 535.000 k.k.
8331LB Steenwijk
€ 375.000 k.k.
8331TA Steenwijk
€ 335.000 k.k.
8331LN Steenwijk
€ 305.000 k.k.

8332JG Steenwijk
€ 950.000 k.k.
€ 3.253/m²
8331KM Steenwijk
€ 575.000 k.k.
€ 5.750/m²

8331JV Steenwijk
€ 225.000 k.k.

8332MC Steenwijk
€ 1.575.000 v.o.n.
