
Residents
18.055
Last year: 2025
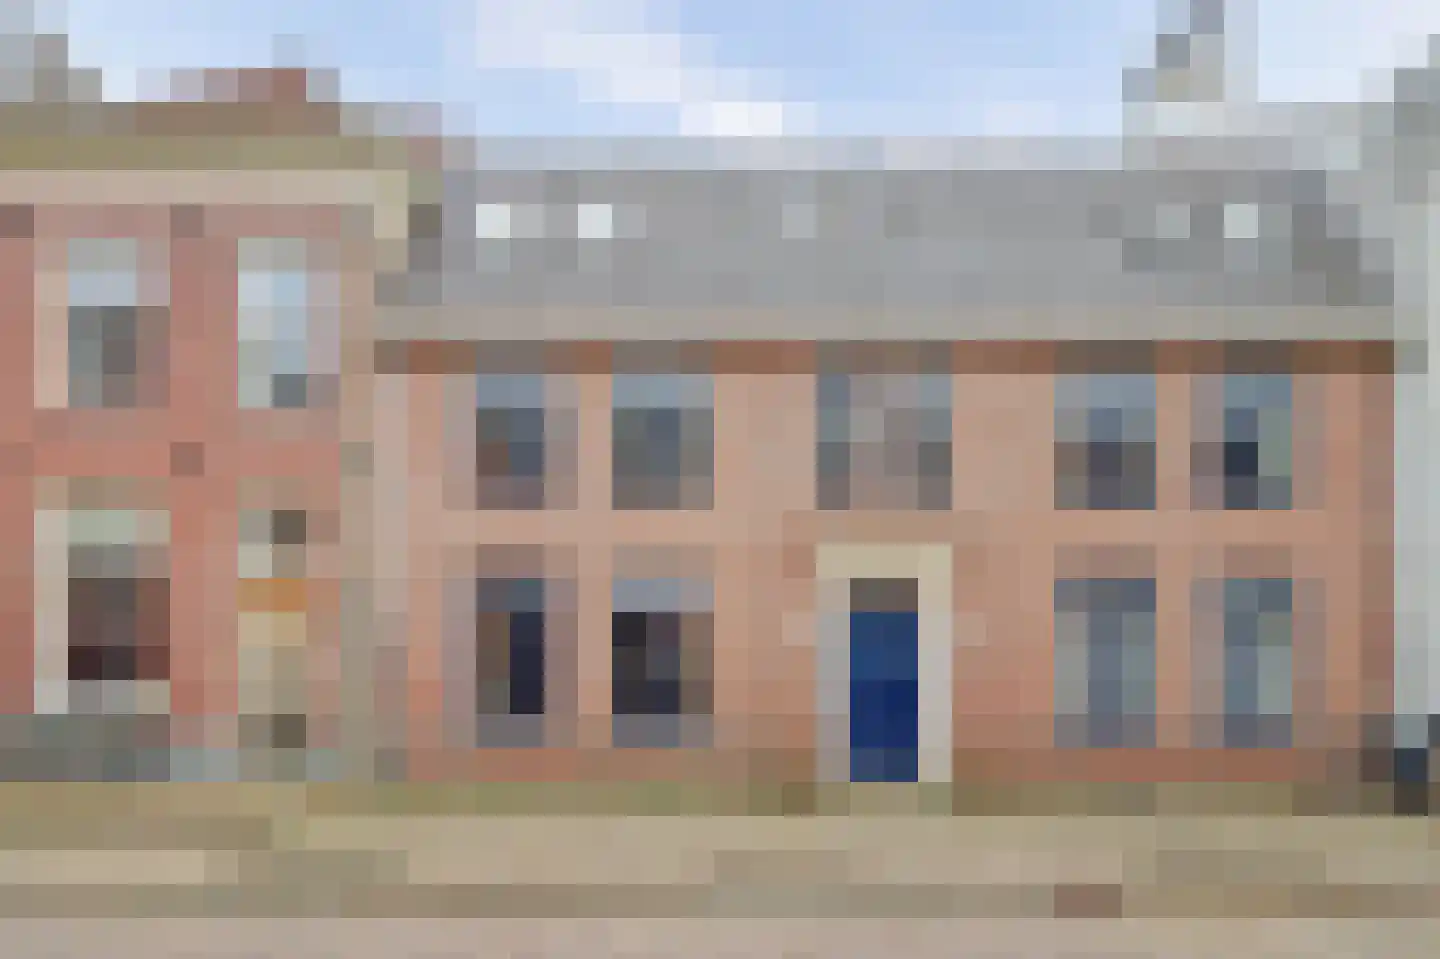
3962LD Wijk bij Duurstede • Utrecht
€ 859.000 k.k.
Cost of copper (estimated): € 19.030
2% transfer tax (€ 17.180) + notary (€ 1.150) + valuation (€ 700)
Total incl. VAT: € 878.030
For this property, no detailed description is available yet.
€ 859.000
Cost of copper (estimated): € 19.030
2% transfer tax (€ 17.180) + notary (€ 1.150) + valuation (€ 700)
Total purchase (incl. p.p.): € 878.030
3,04%
Yearly
€ 42.950
Direct available
Estimated mortgage
Indicative gross monthly cost
Based on annuity and 30 year term
Indicative net monthly cost
iDisclaimer: this mortgage calculation is a simplified indication based on general assumptions. No rights can be derived from the results shown. Calculated with 10-annual interest (zonder NHG), automatically determined based on the price limit € 470.000. Source: 10-jaars rente uit mortgage_rates (30-04-2026 03:45). For non-NHG, an 80% mortgage of the market value has been used in this indication.
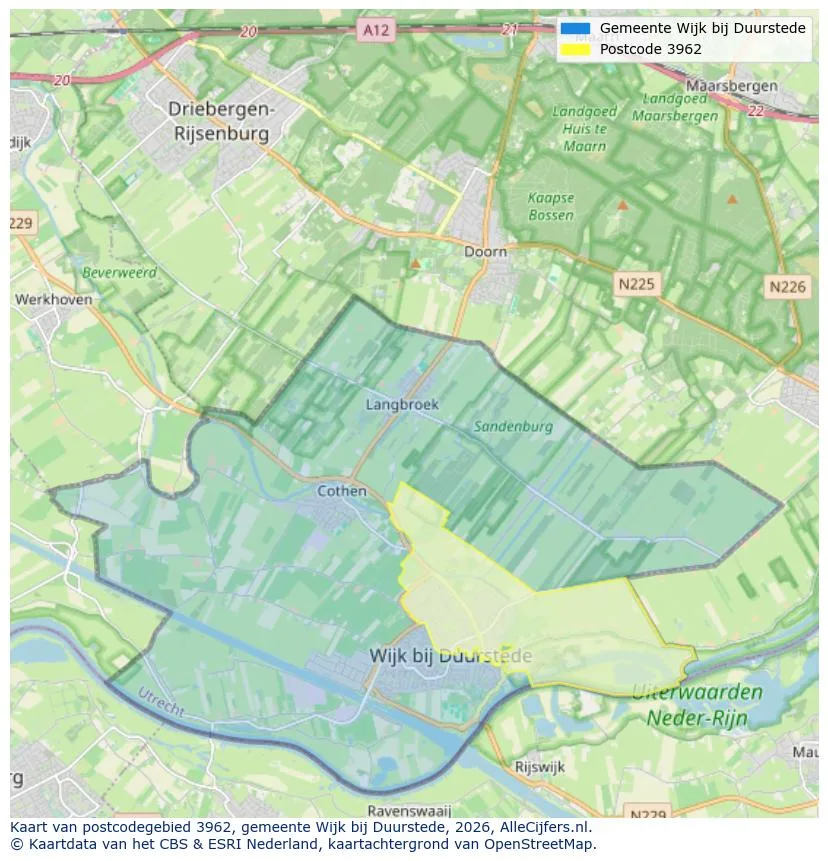
View the location and discover the brokers in this region
View current location data on residents, WOZ development, housing stock, energy consumption, business activity and safety in Wijk bij Duurstede. In 2025 were there 18.055 residents. The average WOZ value in 2025 is EUR 436.973.
Residents
18.055
Last year: 2025
Average WOZ
EUR 436.973
Last year: 2025
Average income per person.
EUR 34.777
Source: AllNumbers
Crimes (current year)
340
Total registered
| Year | Residents |
|---|---|
| 2021 | 18.215 |
| 2022 | 18.190 |
| 2023 | 18.205 |
| 2024 | 18.100 |
| 2025 | 18.055 |
| Year | Average WOZ |
|---|---|
| 2021 | EUR 307.705 |
| 2022 | EUR 341.918 |
| 2023 | EUR 402.835 |
| 2024 | EUR 418.216 |
| 2025 | EUR 436.973 |
Hoger
4.270
Praktisch
3.110
Middelbaar
6.130
Europa
890
Nederland
15.270
Buiten Europa
1.895
Label C
3.366
Label A
1.794
Label B
1.707
Label D
402
Label G
235
Label F
229
Label E
220
Label A+
106
Label A+++
80
Label A++
41
Label A++++
7
Label A+++++
2
| Year | Gas (m3) | Electricity (kWh) |
|---|---|---|
| 2020 | 1.142 | 3.000 |
| 2021 | 1.272 | 3.031 |
| 2022 | 992 | 2.811 |
| 2023 | 831 | 2.612 |
| 2024 | 806 | 2.661 |
Hoekwoning
Gas: 950 • Electricity: 2.767
Huurwoning
Gas: 715 • Electricity: 2.133
Koopwoning
Gas: 889 • Electricity: 2.808
Appartement
Gas: 568 • Electricity: 2.127
Tussenwoning
Gas: 831 • Electricity: 2.575
Vrijstaande woning
Gas: 1.408 • Electricity: 3.979
Twee-onder-één-kap woning
Gas: 1.124 • Electricity: 3.276
Total number of company establishments: 2.340
| Period | Crimes |
|---|---|
| jan 2026 | 33 |
| jul 2025 | 30 |
| jun 2025 | 28 |
| mei 2025 | 41 |
| mrt 2025 | 29 |
| mrt 2026 | 28 |
| nov 2024 | 32 |
| nov 2025 | 22 |
| okt 2024 | 36 |
| okt 2025 | 33 |
| sep 2024 | 22 |
| sep 2025 | 32 |
These figures give an indicative picture of safety trends in the living environment of Wijk bij Duurstede.
Short answers based on current local statistics, handy for a quick comparison of the living environment.
Wijk bij Duurstede telt in 2025 ongeveer 18.055 inwoners.
De gemiddelde WOZ-waarde in Wijk bij Duurstede is in 2025 circa € 436.973.
Het gemiddelde inkomen per inwoner in Wijk bij Duurstede ligt rond € 34.777 per jaar.
Voor het huidige jaar gaat het om ongeveer 340 geregistreerde misdrijven. Gebruik deze cijfers als indicatie en vergelijk trends per periode.
In Wijk bij Duurstede komt vooral "Tussenwoningen" veel voor, met ongeveer 4.224 woningen.
View more homes in this location.

3961BA Wijk bij Duurstede
€ 435.000 k.k.

3961BJ Wijk bij Duurstede
€ 980.000 k.k.

3961MJ Wijk bij Duurstede
€ 495.000 k.k.

3962KJ Wijk bij Duurstede
€ 649.000 k.k.
3961BA Wijk bij Duurstede
€ 350.000 k.k.
€ 6.140/m²

3961BP Wijk bij Duurstede
€ 575.000 k.k.

3962RB Wijk bij Duurstede
€ 297.500 k.k.
€ 8.264/m²
3962JT Wijk bij Duurstede
€ 450.000 k.k.
