
Residents
5.250
Last year: 2025
4341CE Arnemuiden • Zeeland

For this property, no detailed description is available yet.
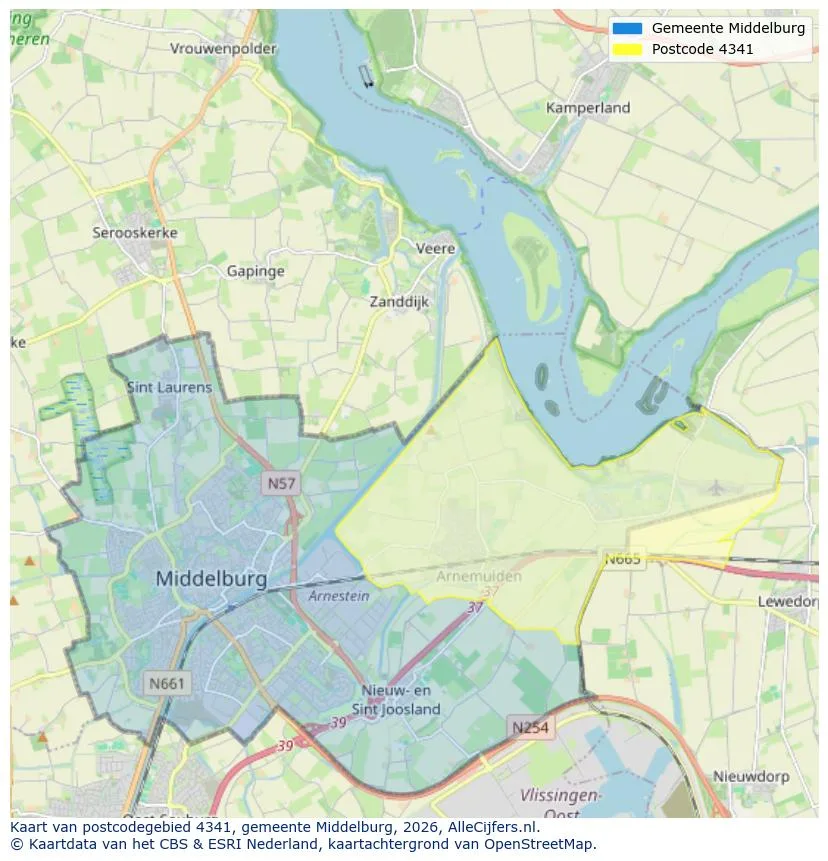
Spatial overview of the work area in Arnemuiden
View current location data on residents, WOZ development, housing stock, energy consumption, business activity and safety in Arnemuiden. In 2025 were there 5.250 residents. The average WOZ value in 2025 is EUR 318.937.
Residents
5.250
Last year: 2025
Average WOZ
EUR 318.937
Last year: 2025
Average income per person.
EUR 28.895
Source: AllNumbers
Crimes (current year)
113
Total registered
| Year | Residents |
|---|---|
| 2021 | 5.360 |
| 2022 | 5.360 |
| 2023 | 5.400 |
| 2024 | 5.320 |
| 2025 | 5.250 |
| Year | Average WOZ |
|---|---|
| 2021 | EUR 224.137 |
| 2022 | EUR 243.740 |
| 2023 | EUR 276.830 |
| 2024 | EUR 300.746 |
| 2025 | EUR 318.937 |
Hoger
630
Praktisch
1.160
Middelbaar
1.840
Europa
220
Nederland
4.830
Buiten Europa
200
Label A
652
Label C
629
Label B
552
Label D
166
Label F
166
Label G
153
Label E
82
Label A+
51
Label A+++
13
Label A++++
12
Label A++
8
Label A+++++
0
| Year | Gas (m3) | Electricity (kWh) |
|---|---|---|
| 2020 | 1.207 | 2.672 |
| 2021 | 1.380 | 2.814 |
| 2022 | 1.069 | 2.624 |
| 2023 | 914 | 2.505 |
| 2024 | 895 | 2.553 |
Hoekwoning
Gas: 895 • Electricity: 2.157
Huurwoning
Gas: 689 • Electricity: 1.816
Koopwoning
Gas: 993 • Electricity: 2.736
Appartement
Gas: 621 • Electricity: 1.834
Tussenwoning
Gas: 757 • Electricity: 1.939
Vrijstaande woning
Gas: 1.186 • Electricity: 3.530
Twee-onder-één-kap woning
Gas: 895 • Electricity: 2.713
Total number of company establishments: 525
| Period | Crimes |
|---|---|
| jan 2026 | 10 |
| jul 2025 | 20 |
| jun 2025 | 5 |
| mei 2025 | 10 |
| mrt 2025 | 11 |
| mrt 2026 | 12 |
| nov 2024 | 3 |
| nov 2025 | 6 |
| okt 2024 | 11 |
| okt 2025 | 8 |
| sep 2024 | 14 |
| sep 2025 | 6 |
These figures give an indicative picture of safety trends in the living environment of Arnemuiden.
Short answers based on current local statistics, handy for a quick comparison of the living environment.
Arnemuiden telt in 2025 ongeveer 5.250 inwoners.
De gemiddelde WOZ-waarde in Arnemuiden is in 2025 circa € 318.937.
Het gemiddelde inkomen per inwoner in Arnemuiden ligt rond € 28.895 per jaar.
Voor het huidige jaar gaat het om ongeveer 113 geregistreerde misdrijven. Gebruik deze cijfers als indicatie en vergelijk trends per periode.
In Arnemuiden komt vooral "Tussenwoningen" veel voor, met ongeveer 743 woningen.
View more homes in this location.

4341LB Arnemuiden
€ 309.500 k.k.

4341MN Arnemuiden
€ 549.000 k.k.
€ 4.159/m²

4341AG Arnemuiden
€ 174.500 k.k.

4341KK Arnemuiden
€ 319.000 k.k.

4341GG Arnemuiden
€ 335.000 k.k.

4341PT Arnemuiden
€ 399.000 k.k.

4341GC Arnemuiden
€ 279.500 k.k.
€ 2.496/m²

4341TC Arnemuiden
€ 1.395.000 k.k.
€ 7.010/m²
