
Residents
570
Last year: 2025
4185MA Est • Gelderland
€ 2.795 p/m
Rental price /m²: € 13
For this property, no detailed description is available yet.
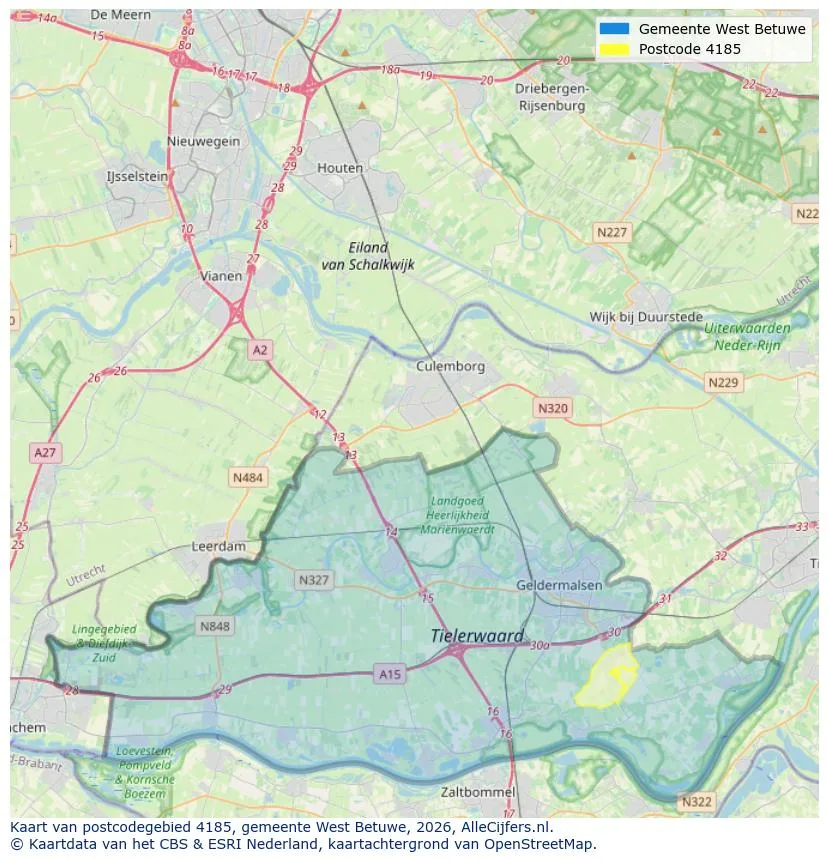
View the location and discover the brokers in this region
View current location data on residents, WOZ development, housing stock, energy consumption, business activity and safety in Est. In 2025 were there 570 residents. The average WOZ value in 2025 is EUR 516.762.
Residents
570
Last year: 2025
Average WOZ
EUR 516.762
Last year: 2025
Average income per person.
EUR 34.764
Source: AllNumbers
Crimes (current year)
5
Total registered
| Year | Residents |
|---|---|
| 2021 | 570 |
| 2022 | 550 |
| 2023 | 565 |
| 2024 | 570 |
| 2025 | 570 |
| Year | Average WOZ |
|---|---|
| 2021 | EUR 388.689 |
| 2022 | EUR 425.292 |
| 2023 | EUR 473.395 |
| 2024 | EUR 506.765 |
| 2025 | EUR 516.762 |
Hoger
70
Praktisch
100
Middelbaar
240
Europa
35
Nederland
510
Buiten Europa
30
Label B
55
Label C
42
Label A
34
Label G
31
Label D
21
Label F
14
Label E
5
Label A+++
4
Label A+
0
Label A++
0
Label A++++
0
Label A+++++
0
| Year | Gas (m3) | Electricity (kWh) |
|---|---|---|
| 2020 | 1.685 | 3.672 |
| 2021 | 1.965 | 3.944 |
| 2022 | 1.543 | 3.589 |
| 2023 | 1.258 | 3.463 |
| 2024 | 1.198 | 3.688 |
Hoekwoning
Gas: 820 • Electricity: 1.825
Huurwoning
Gas: 887 • Electricity: 1.984
Koopwoning
Gas: 1.303 • Electricity: 3.611
Tussenwoning
Gas: 586 • Electricity: 1.273
Vrijstaande woning
Gas: 1.442 • Electricity: 4.057
Twee-onder-één-kap woning
Gas: 862 • Electricity: 2.127
Total number of company establishments: 105
| Period | Crimes |
|---|---|
| jan 2026 | 1 |
| jul 2025 | 0 |
| jun 2025 | 0 |
| mei 2025 | 0 |
| mrt 2025 | 0 |
| mrt 2026 | 0 |
| nov 2024 | 0 |
| nov 2025 | 0 |
| okt 2024 | 1 |
| okt 2025 | 0 |
| sep 2024 | 1 |
| sep 2025 | 0 |
These figures give an indicative picture of safety trends in the living environment of Est.
Short answers based on current local statistics, handy for a quick comparison of the living environment.
Est telt in 2025 ongeveer 570 inwoners.
De gemiddelde WOZ-waarde in Est is in 2025 circa € 516.762.
Het gemiddelde inkomen per inwoner in Est ligt rond € 34.764 per jaar.
Voor het huidige jaar gaat het om ongeveer 5 geregistreerde misdrijven. Gebruik deze cijfers als indicatie en vergelijk trends per periode.
In Est komt vooral "Vrijstaande woningen" veel voor, met ongeveer 146 woningen.
View more homes in this location.

4185NP Est
€ 1.465.000 k.k.
€ 2.941/m²

4185NV Est
€ 415.000 k.k.
€ 4.715/m²

4185NA Est
€ 739.500 k.k.
€ 3.488/m²

4185NC Est
€ 390.000 k.k.
€ 3.714/m²

4185NA Est
€ 475.000 k.k.
€ 4.657/m²

4185NG Est
€ 433.500 k.k.
€ 8.670/m²

4185NH Est
€ 585.000 k.k.
€ 4.465/m²

4185ND Est
€ 375.000 k.k.
€ 4.464/m²
