Residents
1.850
Last year: 2025
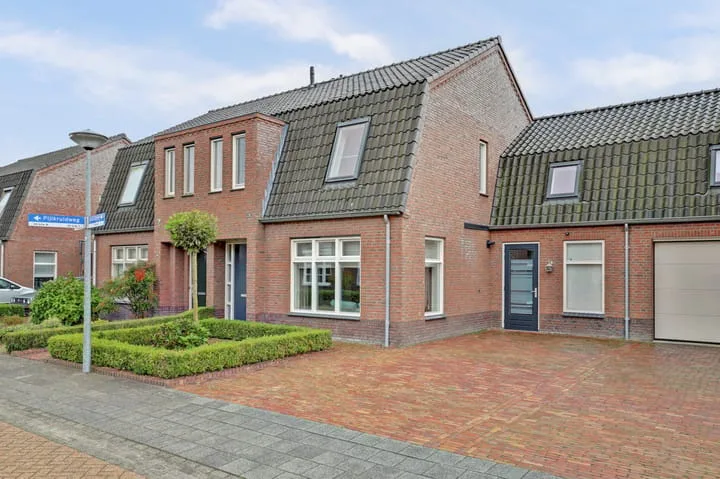
5758CA Neerkant • Noord-Brabant

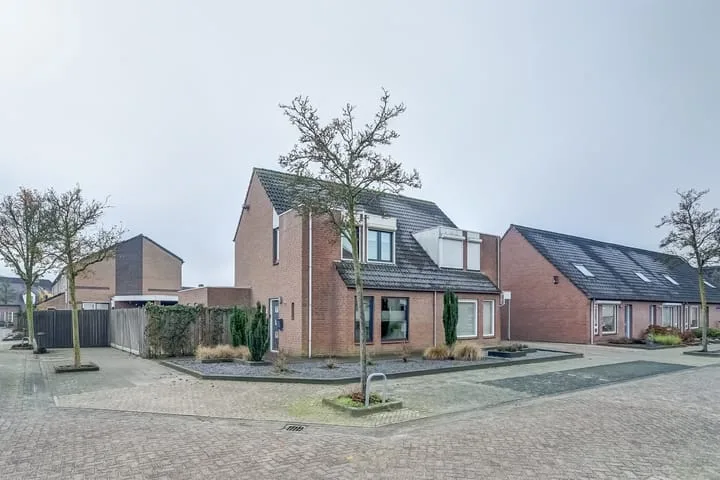
For this property, no detailed description is available yet.
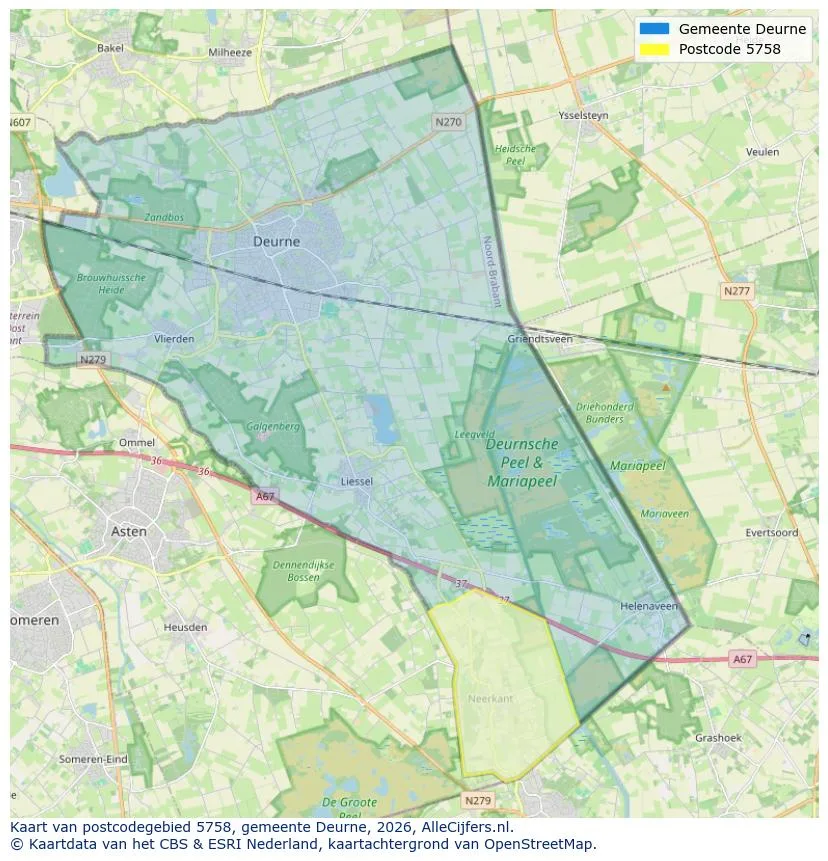
Geographic orientation and real estate agent density in Neerkant
View current location data on residents, WOZ development, housing stock, energy consumption, business activity and safety in Neerkant. In 2025 were there 1.850 residents. The average WOZ value in 2025 is EUR 421.000.
Residents
1.850
Last year: 2025
Average WOZ
EUR 421.000
Last year: 2025
Average income per person.
EUR 31.500
Source: AllNumbers
Crimes (current year)
30
Total registered
| Year | Residents |
|---|---|
| 2021 | 1.900 |
| 2022 | 1.900 |
| 2023 | 1.890 |
| 2024 | 1.865 |
| 2025 | 1.850 |
| Year | Average WOZ |
|---|---|
| 2021 | EUR 294.000 |
| 2022 | EUR 334.000 |
| 2023 | EUR 388.000 |
| 2024 | EUR 402.000 |
| 2025 | EUR 421.000 |
Hoger
310
Praktisch
470
Middelbaar
640
Europa
100
Nederland
1.700
Buiten Europa
45
Label C
182
Label A
135
Label B
131
Label F
113
Label D
82
Label G
48
Label E
26
Label A+
8
Label A+++
4
Label A++
3
Label A++++
1
Label A+++++
0
| Year | Gas (m3) | Electricity (kWh) |
|---|---|---|
| 2020 | 1.620 | 3.820 |
| 2021 | 1.810 | 3.880 |
| 2022 | 1.400 | 3.620 |
| 2023 | 1.140 | 3.440 |
| 2024 | 1.120 | 3.540 |
Hoekwoning
Gas: 920 • Electricity: 2.200
Huurwoning
Gas: 920 • Electricity: 2.370
Koopwoning
Gas: 1.200 • Electricity: 3.740
Appartement
Gas: 900 • Electricity: 2.520
Tussenwoning
Gas: 800 • Electricity: 2.250
Vrijstaande woning
Gas: 1.360 • Electricity: 4.170
Twee-onder-één-kap woning
Gas: 980 • Electricity: 3.100
Total number of company establishments: 280
| Period | Crimes |
|---|---|
| jan 2025 | 0 |
| jan 2026 | 1 |
| jul 2025 | 2 |
| jun 2025 | 4 |
| mei 2025 | 2 |
| mrt 2025 | 1 |
| nov 2024 | 1 |
| nov 2025 | 7 |
| okt 2024 | 2 |
| okt 2025 | 0 |
| sep 2024 | 3 |
| sep 2025 | 5 |
These figures give an indicative picture of safety trends in the living environment of Neerkant.
Short answers based on current local statistics, handy for a quick comparison of the living environment.
Neerkant telt in 2025 ongeveer 1.850 inwoners.
De gemiddelde WOZ-waarde in Neerkant is in 2025 circa € 421.000.
Het gemiddelde inkomen per inwoner in Neerkant ligt rond € 31.500 per jaar.
Voor het huidige jaar gaat het om ongeveer 30 geregistreerde misdrijven. Gebruik deze cijfers als indicatie en vergelijk trends per periode.
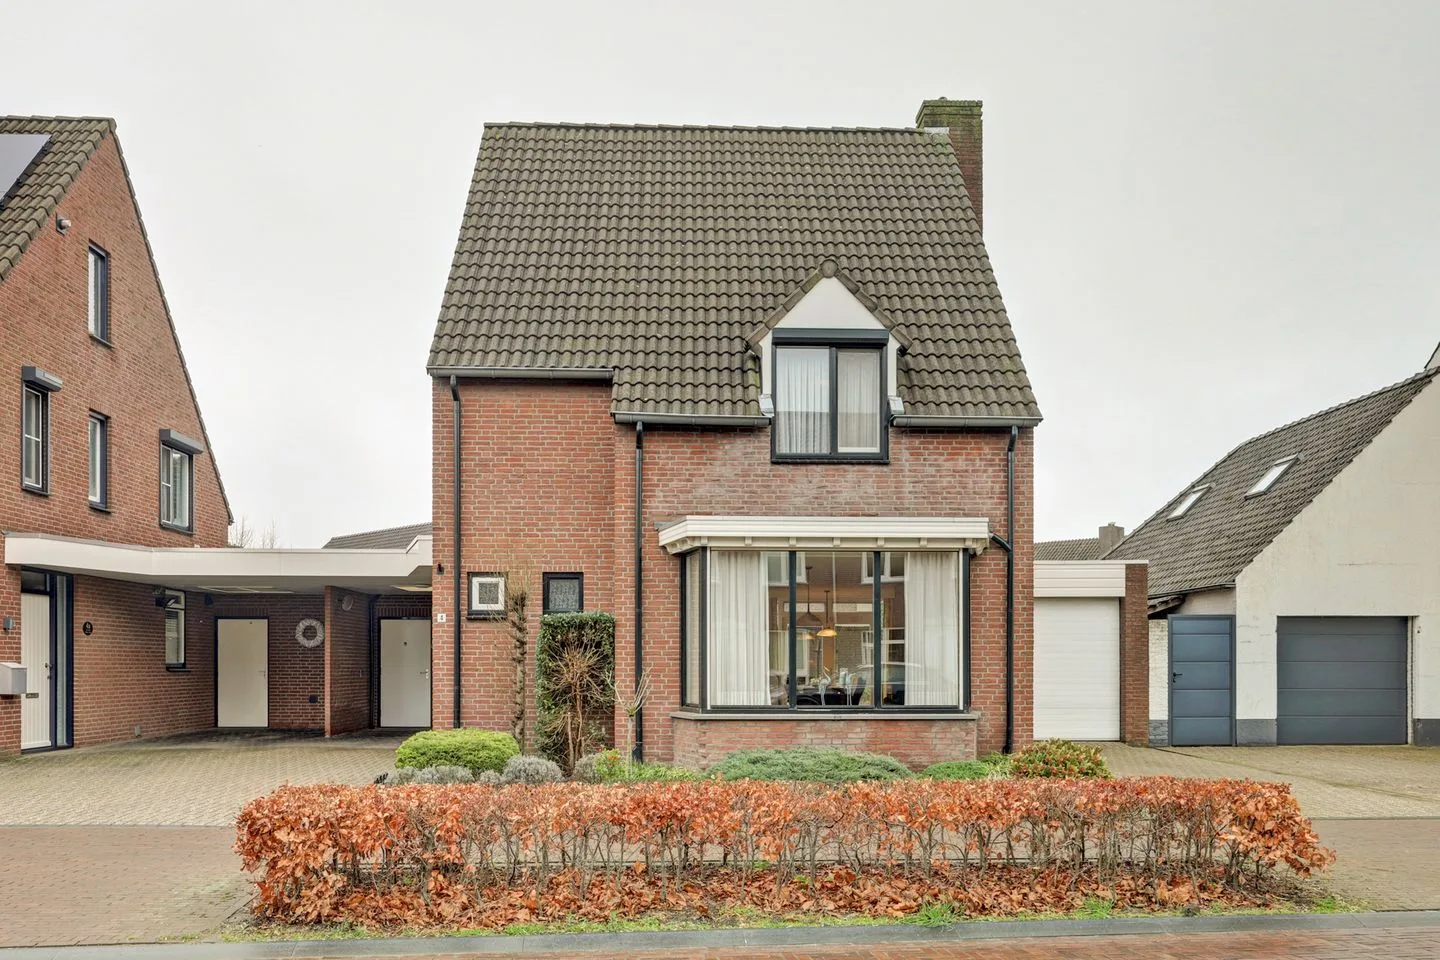
In Neerkant komt vooral "Vrijstaande woningen" veel voor, met ongeveer 407 woningen.
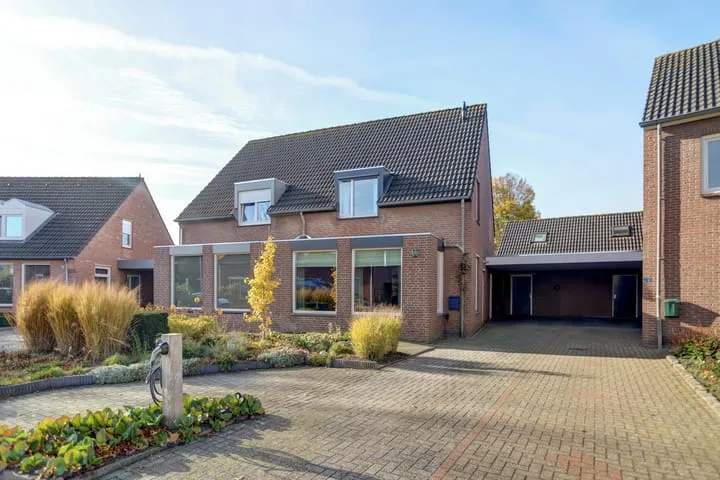
View more homes in this location.
5758AR Neerkant
€ 429.000 k.k.
€ 2.466/m²

5758AK Neerkant
€ 398.000 k.k.
€ 3.553/m²

5758AE Neerkant
€ 449.000 k.k.
€ 3.870/m²
5758BK Neerkant
€ 435.000 k.k.
€ 3.129/m²
5758CC Neerkant
€ 489.000 k.k.
€ 3.114/m²

5758PV Neerkant
€ 629.000 k.k.
€ 4.368/m²

5758CA Neerkant
€ 349.004 k.k.
€ 2.982/m²

5758AD Neerkant
€ 649.000 k.k.
€ 2.977/m²
