
Makelaardij Wolvers
Real estate agency Wolvers offers reliable and goal-oriented real estate services in Alphen aan den Rijn and the surrounding area. We help you with confidence and professionalism when buying or selling your home, so that you can take the right step in your life. We provide service in the field of sales and purchase, with a strong focus on customer orientation. Our expertise is supported by the VastgoedCert certificate and we communicate...
Current housing stock
-

- Available
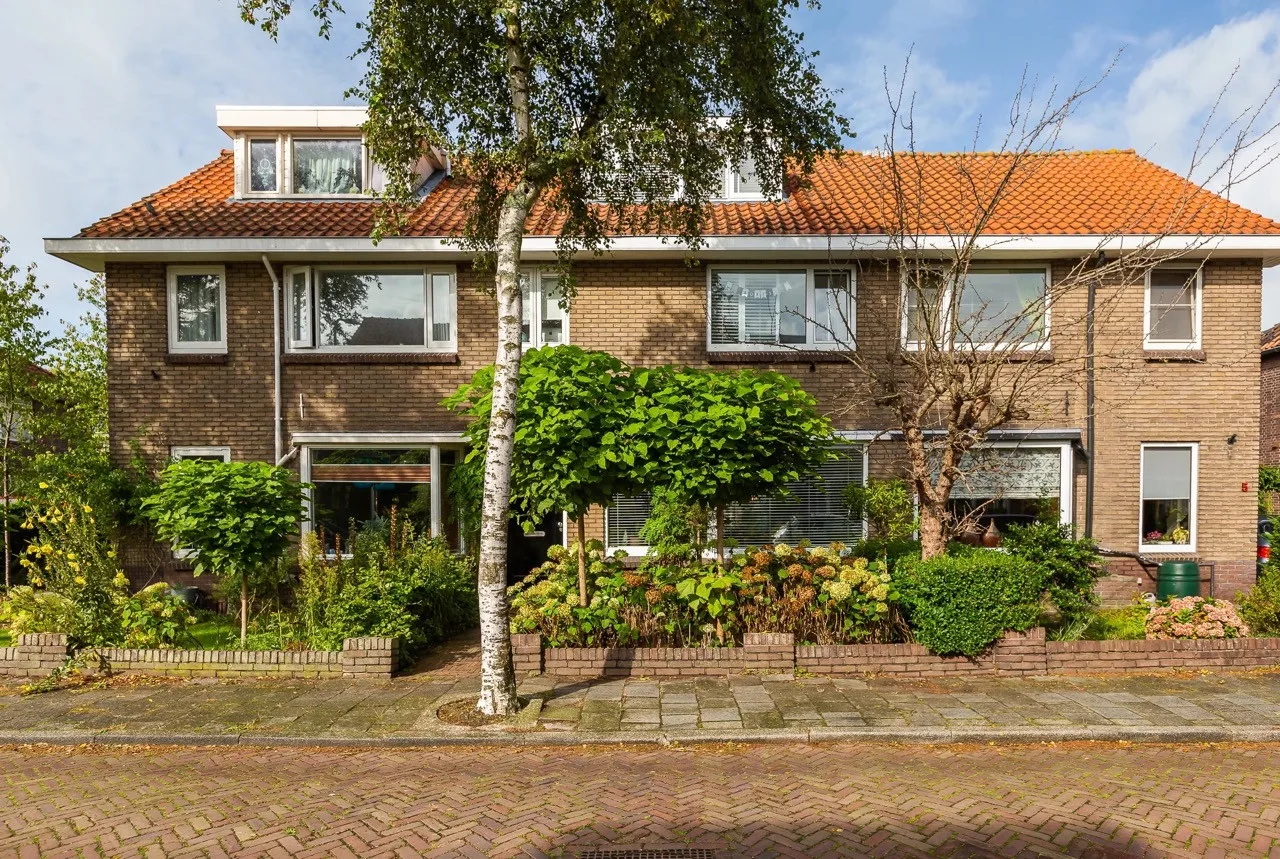
Sterrenlaan 121
2402AV Alphen aan den Rijn
€ 500.000 k.k.
BSave as favorite- Living area
- 128 m²
- Land area
- 131 m²
- Bedrooms
- 5
-

- Sold subject to confirmation
Schepenstraat 35
2461SN Ter Aar
€ 470.000 k.k.
€ 4.086/m²
ASave as favorite- Living area
- 115 m²
- Land area
- 126 m²
- Bedrooms
- 4
-

- Purchased
Marsdiep 211
2401XE Alphen aan den Rijn
€ 250.000 k.k.
€ 3.378/m²
FSave as favorite- Living area
- 74 m²
- Land area
- —
- Bedrooms
- 2
-

- Purchased
Vliestroom 13
2401VA Alphen aan den Rijn
€ 235.000 k.k.
€ 5.222/m²
GSave as favorite- Living area
- 45 m²
- Land area
- —
- Bedrooms
- 1
-

- Purchased
Polderpeil 294
2408RJ Alphen aan den Rijn
€ 550.000 k.k.
€ 5.045/m²
ASave as favorite- Living area
- 109 m²
- Land area
- —
- Bedrooms
- 2
-

- Purchased
Schuberthof 33
2402GH Alphen aan den Rijn
€ 425.000 k.k.
€ 3.541/m²
CSave as favorite- Living area
- 120 m²
- Land area
- 138 m²
- Bedrooms
- 4

Reviews (88)
Review platforms
BronscoresTotal score
88 total reviews

Funda
27 reviews on Funda

61 reviews on Google
-
marije lenting
10Monique Wolvers heeft ons geholpen bij de aankoop van ons eerste koophuis. Ze heeft veel ervaring, wat goed helpt bij de aankoop. Ze staat altijd open om al je vragen te beantwoorden, ze is veel en snel bereikbaar. Verder is Monique een heel fijn persoon en heel enthousiast, wat het hele koopproces leuk maakt :)
-
Polderpeil 294
10Translated by AIRight from the start, there was a click. After that, we could switch quickly. Monique is quick with answers and thinks along well
-
Emma Van Kins
10Translated by AII am very happy that Monique was my real estate agent when I bought my first home! As a first-time buyer on the housing market, I really benefited from her knowledge and guidance throughout this process. Monique has always been available for questions or explanations. In addition to her expertise as an agent, she is also very nice, so in my opinion, the perfect real estate agent! Once again, thank you very much Monique!
-
Marsdiep 211
10Translated by AIMonique Wolvers has helped us incredibly well in our search for an affordable flat for our son. Thanks to her expert help, it was possible. She is expert, straightforward and very friendly.
-
Max kouw
10Translated by AIWe are extremely satisfied with our real estate agent Monique. She is very friendly, helpful and always a pleasure to talk to. From the first contact we felt at ease and well guided. Monique thinks along, takes her time and is really there for you. We would definitely recommend her to others looking for an involved and reliable real estate agent. With kind regards, Max and Sanne
-
Kortsteekterweg 25
10Translated by AIMonique is a great real estate agent. She helped us super well. We could not have found a better one. She is a friendly, cheerful, lovely woman. Definitely a recommendation 👍👍👍
-
Judith
10Translated by AIMonique is super nice to work with. She is always available for questions and ensures that the purchasing process flows smoothly. We received excellent advice on the purchase and after the winning bid we were also fully supported and guided in making the choices. She really takes that extra step to make sure everything comes together. We would definitely recommend Monique, not only because she is very knowledgeable, but also because she is super enthusiastic!
-
Braziliëstraat 49
8Translated by AIHad a good contact with Monique. She thinks along well with the wishes and gave valuable tips during the conversations and final inspection. Moreover, she was very accessible and friendly.
-
Elzenstraat 10
10Translated by AIMonique accompanied us very nicely in the purchase of our first house! Gives fine and expert advice.
-
Cantharel 82
10Translated by AIMonique is a top performer! She supports and guides you from A to Z and has the perfect answer for all questions. She is involved in the expressed wishes and likes to think along.
-
Brederodestraat 18
10Translated by AIOn July 18th I asked Monique to become my buyer's agent and on July 30th I heard that it had been successful in buying my house! Monique is involved, always available and very enthusiastic. She also has a large network and together with her enthusiasm this ensures that she can support you very well when buying a home.
-
Michelle
10Translated by AIJust like all other reviews, enormously impressed with the collaboration with Monique Wolvers. She is very professional, but absolutely does not forget the human aspect when buying a house. We really needed her services for the purchase of an apartment. Without her critical perspective, decisiveness, but also very friendly approach, we would never have been able to get a house. Wolvers Real Estate thinks along, is always easily accessible and ensures a good handling of matters that we know too little about.
-
Lupinesingel 266
10Translated by AIThe contract was very personal and very pleasant. Always friendly and cheerful. She listened very well to our wishes and gave us excellent advice. Very expert. We would like to recommend her to our friends and acquaintances.
-
Tolstraat 2 B
9Translated by AIWe are incredibly satisfied with our sales broker! From the very first contact, we were helped professionally and kindly. The communication was clear, fast, and personal, and we truly felt taken care of during the entire sales process. Thanks to her expertise and commitment, our house was sold quickly and for a good price. Absolutely recommended!
-
Plutostraat 18
10Translated by AIMonique is a genuine person with a lot of empathy. Always gives honest, transparent and professional feedback to me as a salesperson and also to the sellers. This guarantees a successful sale or purchase. She has many contacts that have proven very valuable to us. In short, she is a pleasant real estate agent who is well rooted in this area.
-
Spanjesingel 86
9Translated by AIFrom the beginning, Monique Wolvers was enormously involved in our search for a house. And always with an optimistic attitude. You notice that she is busy, but when something important needs to happen, you can count on her to commit 110% to you. And that has ensured that we already had a house after attempt 3. Thank you Monique!
-
P. van Schravendijkstraat 39
10Translated by AIExcellent real estate agent, with attention to the seller. Not everything via email and phone, still some old-fashioned contact
-
Roosje Vosstraat 16
10Translated by AIMonique was driven, expert and very pleasant to deal with and does not adhere to fixed office hours. We have experienced this as very pleasant.
-
Langenhorst 30
10Translated by AIMonique fantastically guided us throughout the entire process - both for the purchase and the sale. She is always easily accessible, communicates clearly, and genuinely thinks along with you. In addition, she is also incredibly friendly and pleasant to deal with. Thanks to her, everything felt smooth and familiar. An absolute recommendation!
-
Gertjan Jonker
10Translated by AIVery satisfied with the collaboration with Monique Wolvers. I was able to leave the sale of my house with great confidence to Monique Wolvers. From the first moment, the communication was clear and pleasant. Monique responds quickly, thinks proactively and keeps you well informed of every step in the process. What I really liked was her personal and involved approach. She listens carefully, has an eye for the situation and comes up with clear and realistic advice. I felt truly taken seriously, without unnecessary pressure being applied. Monique has a lot of knowledge of the local market and knows exactly which resources and sales methods are effective at what time. Thanks to her thoughtful approach, the sale got off to a quick start. The property was professionally presented and well publicized, resulting in serious interest and ultimately a beautiful result. She is persistent and does not lose sight of the importance of her client. Monique thinks strategically, recognizes which bidders are promising and directs them in a calm but decisive manner. In short: a reliable, accessible and expert real estate agent who is pleasant to work with. I am happy that I chose her and can certainly recommend her to others who want to sell their house.