
Residents
3.684
Last year: 2025
7971CH Havelte • Drenthe

For this property, no detailed description is available yet.
€ 489.500
Cost of copper (estimated): € 11.640
2% transfer tax (€ 9.790) + notary (€ 1.150) + valuation (€ 700)
Total purchase (incl. p.p.): € 501.140
3,04%
Yearly
€ 24.475
Direct available
Estimated mortgage
Indicative gross monthly cost
Based on annuity and 30 year term
Indicative net monthly cost
iDisclaimer: this mortgage calculation is a simplified indication based on general assumptions. No rights can be derived from the results shown. Calculated with 10-annual interest (zonder NHG), automatically determined based on the price limit € 470.000. Source: 10-jaars rente uit mortgage_rates (28-04-2026 04:00). For non-NHG, an 80% mortgage of the market value has been used in this indication.
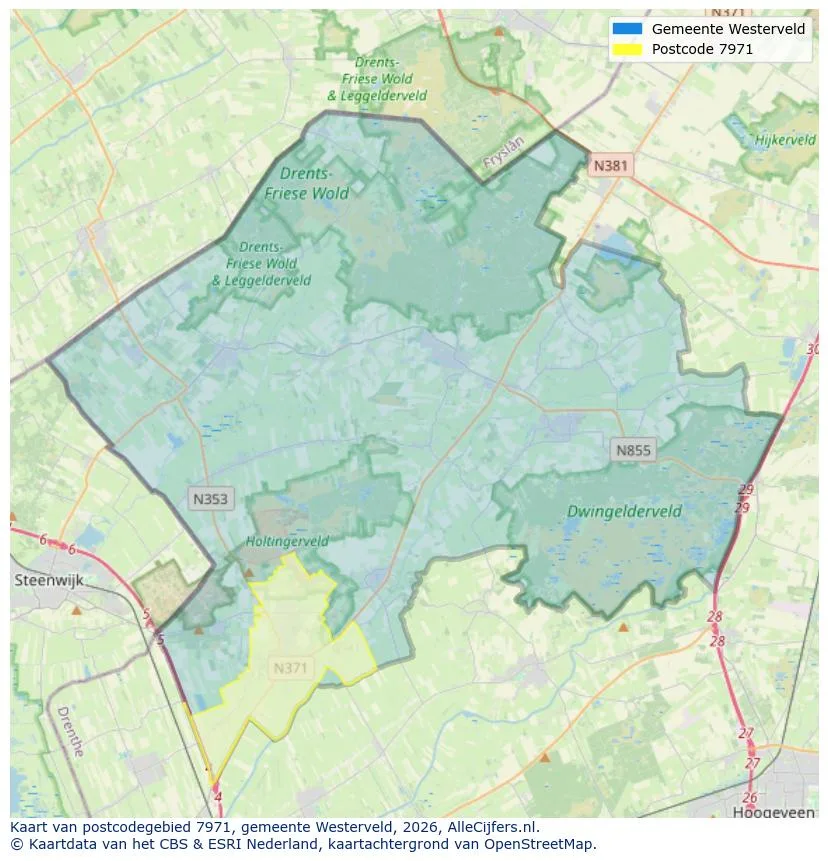
Discover where agents are active in Havelte
View current location data on residents, WOZ development, housing stock, energy consumption, business activity and safety in Havelte. In 2025 were there 3.684 residents. The average WOZ value in 2025 is EUR 403.770.
Residents
3.684
Last year: 2025
Average WOZ
EUR 403.770
Last year: 2025
Average income per person.
EUR 29.310
Source: AllNumbers
Crimes (current year)
71
Total registered
| Year | Residents |
|---|---|
| 2021 | 3.705 |
| 2022 | 3.720 |
| 2023 | 3.724 |
| 2024 | 3.719 |
| 2025 | 3.684 |
| Year | Average WOZ |
|---|---|
| 2021 | EUR 286.621 |
| 2022 | EUR 309.388 |
| 2023 | EUR 355.074 |
| 2024 | EUR 372.737 |
| 2025 | EUR 403.770 |
Hoger
793
Praktisch
642
Middelbaar
1.060
Europa
142
Nederland
3.339
Buiten Europa
203
Label A
441
Label B
399
Label C
360
Label D
227
Label G
133
Label F
127
Label E
52
Label A+
19
Label A+++
17
Label A++
12
Label A++++
0
Label A+++++
0
| Year | Gas (m3) | Electricity (kWh) |
|---|---|---|
| 2020 | 1.515 | 2.832 |
| 2021 | 1.711 | 2.875 |
| 2022 | 1.325 | 2.761 |
| 2023 | 1.093 | 2.659 |
| 2024 | 1.038 | 2.792 |
Hoekwoning
Gas: 861 • Electricity: 1.882
Huurwoning
Gas: 901 • Electricity: 1.884
Koopwoning
Gas: 1.196 • Electricity: 3.004
Appartement
Gas: 658 • Electricity: 1.774
Tussenwoning
Gas: 781 • Electricity: 1.731
Vrijstaande woning
Gas: 1.420 • Electricity: 3.335
Twee-onder-één-kap woning
Gas: 1.046 • Electricity: 2.788
Total number of company establishments: 472
| Period | Crimes |
|---|---|
| jan 2025 | 8 |
| jan 2026 | 6 |
| jul 2025 | 6 |
| jun 2025 | 5 |
| mei 2025 | 3 |
| mrt 2025 | 9 |
| nov 2024 | 8 |
| nov 2025 | 3 |
| okt 2024 | 8 |
| okt 2025 | 7 |
| sep 2024 | 6 |
| sep 2025 | 9 |
These figures give an indicative picture of safety trends in the living environment of Havelte.
Short answers based on current local statistics, handy for a quick comparison of the living environment.
Havelte telt in 2025 ongeveer 3.684 inwoners.
De gemiddelde WOZ-waarde in Havelte is in 2025 circa € 403.770.
Het gemiddelde inkomen per inwoner in Havelte ligt rond € 29.310 per jaar.
Voor het huidige jaar gaat het om ongeveer 71 geregistreerde misdrijven. Gebruik deze cijfers als indicatie en vergelijk trends per periode.
In Havelte komt vooral "Vrijstaande woningen" veel voor, met ongeveer 670 woningen.
View more homes in this location.

7971EA Havelte
€ 709.000 k.k.
7971BR Havelte
€ 389.000 k.k.

7971AR Havelte
€ 575.000 k.k.

7971DC Havelte
€ 375.000 k.k.

7971EB Havelte
€ 875.000 k.k.
€ 5.116/m²

7971EJ Havelte
€ 259.500 k.k.
€ 4.718/m²

7971AL Havelte
€ 574.000 k.k.
€ 4.484/m²

7971CA Havelte
€ 525.000 k.k.
€ 6.034/m²
