
Residents
2.780
Last year: 2025
8315AZ Luttelgeest • Flevoland
For this property, no detailed description is available yet.
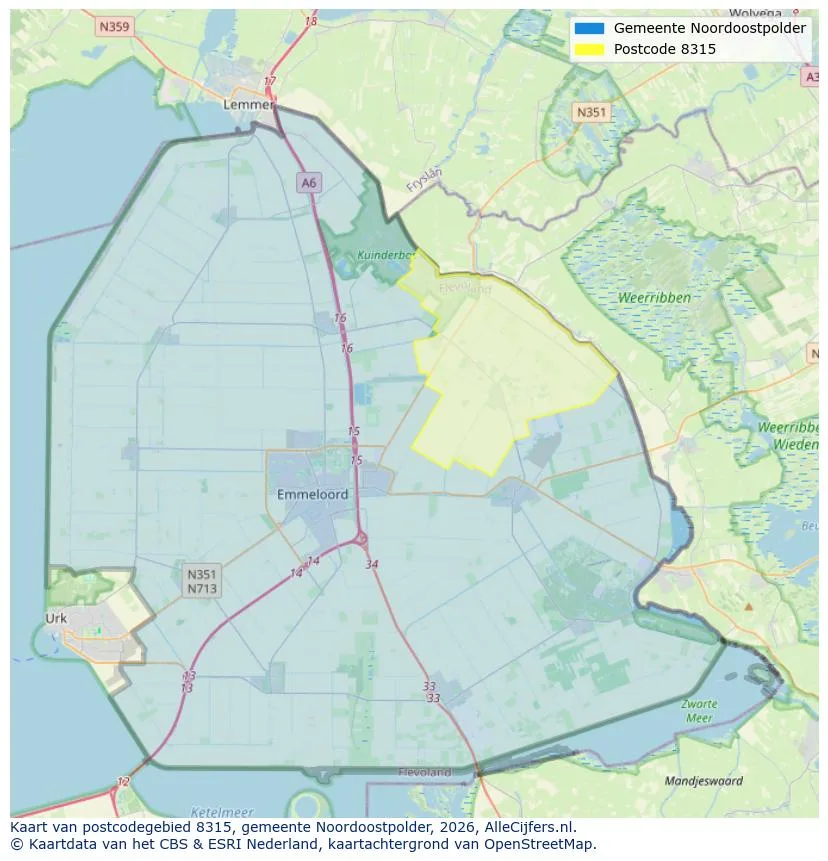
Explore Luttelgeest and the surrounding areas
View current location data on residents, WOZ development, housing stock, energy consumption, business activity and safety in Luttelgeest. In 2025 were there 2.780 residents. The average WOZ value in 2025 is EUR 275.000.
Residents
2.780
Last year: 2025
Average WOZ
EUR 275.000
Last year: 2025
Average income per person.
EUR 28.400
Source: AllNumbers
Crimes (current year)
73
Total registered
| Year | Residents |
|---|---|
| 2021 | 2.290 |
| 2022 | 2.200 |
| 2023 | 2.540 |
| 2024 | 2.460 |
| 2025 | 2.780 |
| Year | Average WOZ |
|---|---|
| 2021 | EUR 226.000 |
| 2022 | EUR 247.000 |
| 2023 | EUR 251.000 |
| 2024 | EUR 268.000 |
| 2025 | EUR 275.000 |
Hoger
450
Praktisch
650
Middelbaar
1.020
Europa
660
Nederland
1.410
Buiten Europa
710
Label A
457
Label B
234
Label F
152
Label C
115
Label E
96
Label A+++
45
Label D
32
Label G
15
Label A+
11
Label A++
9
Label A++++
2
Label A+++++
0
| Year | Gas (m3) | Electricity (kWh) |
|---|---|---|
| 2020 | 1.580 | 3.480 |
| 2021 | 1.730 | 3.550 |
| 2022 | 1.340 | 3.350 |
| 2023 | 930 | 2.830 |
| 2024 | 900 | 3.030 |
Hoekwoning
Gas: 880 • Electricity: 2.710
Huurwoning
Gas: 640 • Electricity: 1.940
Koopwoning
Gas: 1.140 • Electricity: 3.450
Appartement
Gas: 430 • Electricity: 1.600
Tussenwoning
Gas: 700 • Electricity: 1.950
Vrijstaande woning
Gas: 1.470 • Electricity: 4.360
Twee-onder-één-kap woning
Gas: 920 • Electricity: 3.290
Total number of company establishments: 340
| Period | Crimes |
|---|---|
| jan 2025 | 9 |
| jan 2026 | 7 |
| jul 2025 | 4 |
| jun 2025 | 12 |
| mei 2025 | 1 |
| mrt 2025 | 3 |
| nov 2024 | 1 |
| nov 2025 | 5 |
| okt 2024 | 10 |
| okt 2025 | 8 |
| sep 2024 | 4 |
| sep 2025 | 7 |
These figures give an indicative picture of safety trends in the living environment of Luttelgeest.
Short answers based on current local statistics, handy for a quick comparison of the living environment.
Luttelgeest telt in 2025 ongeveer 2.780 inwoners.
De gemiddelde WOZ-waarde in Luttelgeest is in 2025 circa € 275.000.
Het gemiddelde inkomen per inwoner in Luttelgeest ligt rond € 28.400 per jaar.
Voor het huidige jaar gaat het om ongeveer 73 geregistreerde misdrijven. Gebruik deze cijfers als indicatie en vergelijk trends per periode.
In Luttelgeest komt vooral "Tussenwoningen" veel voor, met ongeveer 351 woningen.
View more homes in this location.

8315PX Luttelgeest
€ 59.000 k.k.
€ 797/m²

8315AJ Luttelgeest
€ 273.000 k.k.
€ 3.250/m²
8315AH Luttelgeest
€ 259.000 k.k.
€ 3.238/m²

8315AJ Luttelgeest
€ 309.000 k.k.
€ 3.679/m²

8315AB Luttelgeest
€ 450.000 k.k.
€ 2.778/m²

8315AK Luttelgeest
€ 279.000 k.k.
€ 3.282/m²

8315AB Luttelgeest
€ 369.000 k.k.
€ 3.765/m²

8315AK Luttelgeest
€ 250.000 k.k.
€ 2.976/m²
