
Residents
2.675
Last year: 2025
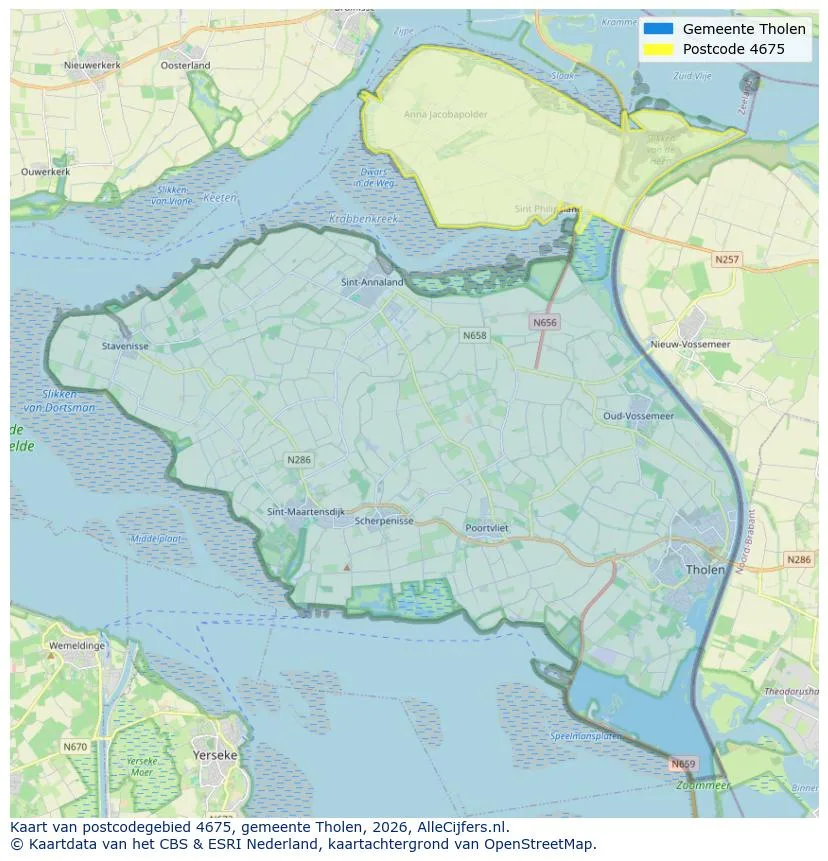
4675CA Sint Philipsland • Zeeland
€ 499.500 k.k.
Cost of copper (estimated): € 11.840
2% transfer tax (€ 9.990) + notary (€ 1.150) + valuation (€ 700)
Total incl. VAT: € 511.340
Purchase price /m²: € 1.368
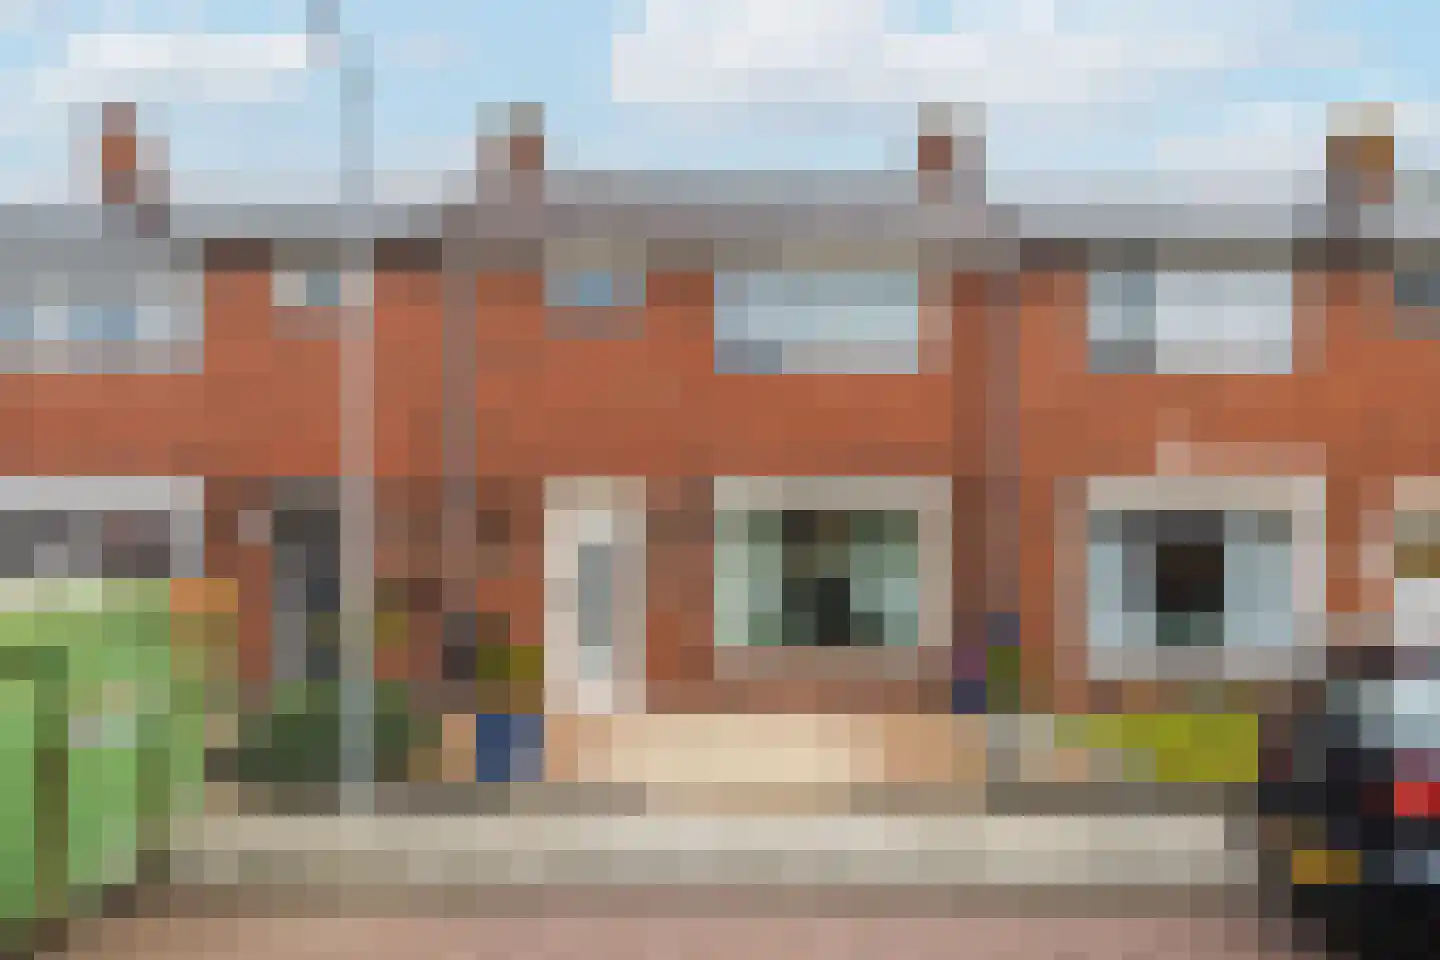
Voorstraat 41 in Sint Philipsland is een multifunctioneel pand met veel potentieel. Momenteel ingericht als restaurant met barfunctie en professionele keuken, biedt het diverse mogelijkheden, zoals een hotelfunctie of twee aparte bewoonbare appartementen. Het heeft een ruime horecakeuken, toiletgroepen, bergingen en een overkapping aan de achterzijde. De eerste verdieping bevat een groot woonappartement met dakterras, badkamer, twee slaapkamers en stookruimte. Het pand heeft totaal 365 m² gebruiksoppervlak, waarbij het appartement F-energieplaatjes heeft en de rest B. Sint Philipsland is een rustig dorp met veel watersportmogelijkheden, nabij Rotterdam en Bergen op Zoom.
€ 499.500
Cost of copper (estimated): € 11.840
2% transfer tax (€ 9.990) + notary (€ 1.150) + valuation (€ 700)
Total purchase (incl. p.p.): € 511.340
3,04%
Yearly
€ 24.975
Direct available
Estimated mortgage
Indicative gross monthly cost
Based on annuity and 30 year term
Indicative net monthly cost
iDisclaimer: this mortgage calculation is a simplified indication based on general assumptions. No rights can be derived from the results shown. Calculated with 10-annual interest (zonder NHG), automatically determined based on the price limit € 470.000. Source: 10-jaars rente uit mortgage_rates (05-05-2026 03:45). For non-NHG, an 80% mortgage of the market value has been used in this indication.
Douche, toilet, en wastafel
Discover where agents are active in Sint Philipsland
View current location data on residents, WOZ development, housing stock, energy consumption, business activity and safety in Sint Philipsland. In 2025 were there 2.675 residents. The average WOZ value in 2025 is EUR 299.000.
Residents
2.675
Last year: 2025
Average WOZ
EUR 299.000
Last year: 2025
Average income per person.
EUR 32.300
Source: AllNumbers
Crimes (current year)
61
Total registered
| Year | Residents |
|---|---|
| 2021 | 2.675 |
| 2022 | 2.715 |
| 2023 | 2.745 |
| 2024 | 2.700 |
| 2025 | 2.675 |
| Year | Average WOZ |
|---|---|
| 2021 | EUR 208.000 |
| 2022 | EUR 226.000 |
| 2023 | EUR 261.000 |
| 2024 | EUR 286.000 |
| 2025 | EUR 299.000 |
Hoger
340
Praktisch
620
Middelbaar
1.030
Europa
175
Nederland
2.395
Buiten Europa
110
Label C
249
Label B
192
Label F
178
Label A
146
Label G
134
Label D
115
Label E
73
Label A+++
14
Label A+
10
Label A++
6
Label A++++
1
Label A+++++
0
| Year | Gas (m3) | Electricity (kWh) |
|---|---|---|
| 2020 | 1.260 | 2.840 |
| 2021 | 1.430 | 3.090 |
| 2022 | 1.110 | 2.960 |
| 2023 | 940 | 2.870 |
| 2024 | 920 | 2.980 |
Hoekwoning
Gas: 910 • Electricity: 2.550
Huurwoning
Gas: 840 • Electricity: 1.920
Koopwoning
Gas: 960 • Electricity: 3.080
Appartement
Gas: 580 • Electricity: 1.400
Tussenwoning
Gas: 800 • Electricity: 2.420
Vrijstaande woning
Gas: 1.190 • Electricity: 3.830
Twee-onder-één-kap woning
Gas: 960 • Electricity: 3.140
Total number of company establishments: 370
| Period | Crimes |
|---|---|
| jan 2026 | 3 |
| jul 2025 | 4 |
| jun 2025 | 9 |
| mei 2025 | 6 |
| mrt 2025 | 5 |
| mrt 2026 | 6 |
| nov 2024 | 7 |
| nov 2025 | 3 |
| okt 2024 | 8 |
| okt 2025 | 1 |
| sep 2024 | 3 |
| sep 2025 | 6 |
These figures give an indicative picture of safety trends in the living environment of Sint Philipsland.
Short answers based on current local statistics, handy for a quick comparison of the living environment.
Sint Philipsland telt in 2025 ongeveer 2.675 inwoners.
De gemiddelde WOZ-waarde in Sint Philipsland is in 2025 circa € 299.000.
Het gemiddelde inkomen per inwoner in Sint Philipsland ligt rond € 32.300 per jaar.
Voor het huidige jaar gaat het om ongeveer 61 geregistreerde misdrijven. Gebruik deze cijfers als indicatie en vergelijk trends per periode.
In Sint Philipsland komt vooral "Tussenwoningen" veel voor, met ongeveer 411 woningen.
View more homes in this location.

4675CD Sint Philipsland
€ 285.000 k.k.
€ 3.476/m²

4675CL Sint Philipsland
€ 309.500 k.k.

4675RP Sint Philipsland
€ 249.500 k.k.
€ 3.838/m²

4675CK Sint Philipsland
€ 225.000 k.k.
€ 3.462/m²
4675BE Sint Philipsland
€ 245.000 k.k.
€ 2.849/m²

4675CL Sint Philipsland
€ 385.000
€ 4.639/m²

4675CL Sint Philipsland
€ 389.000
€ 4.687/m²

4675CL Sint Philipsland
€ 359.000
€ 4.325/m²
