
Residents
1.540
Last year: 2025
6116AH Roosteren • Limburg

For this property, no detailed description is available yet.
€ 1.200.000
Cost of copper (estimated): € 25.850
2% transfer tax (€ 24.000) + notary (€ 1.150) + valuation (€ 700)
Total purchase (incl. p.p.): € 1.225.850
3,04%
Yearly
€ 60.000
Direct available
Estimated mortgage
Indicative gross monthly cost
Based on annuity and 30 year term
Indicative net monthly cost
iDisclaimer: this mortgage calculation is a simplified indication based on general assumptions. No rights can be derived from the results shown. Calculated with 10-annual interest (zonder NHG), automatically determined based on the price limit € 470.000. Source: 10-jaars rente uit mortgage_rates (27-04-2026 04:00). For non-NHG, an 80% mortgage of the market value has been used in this indication.
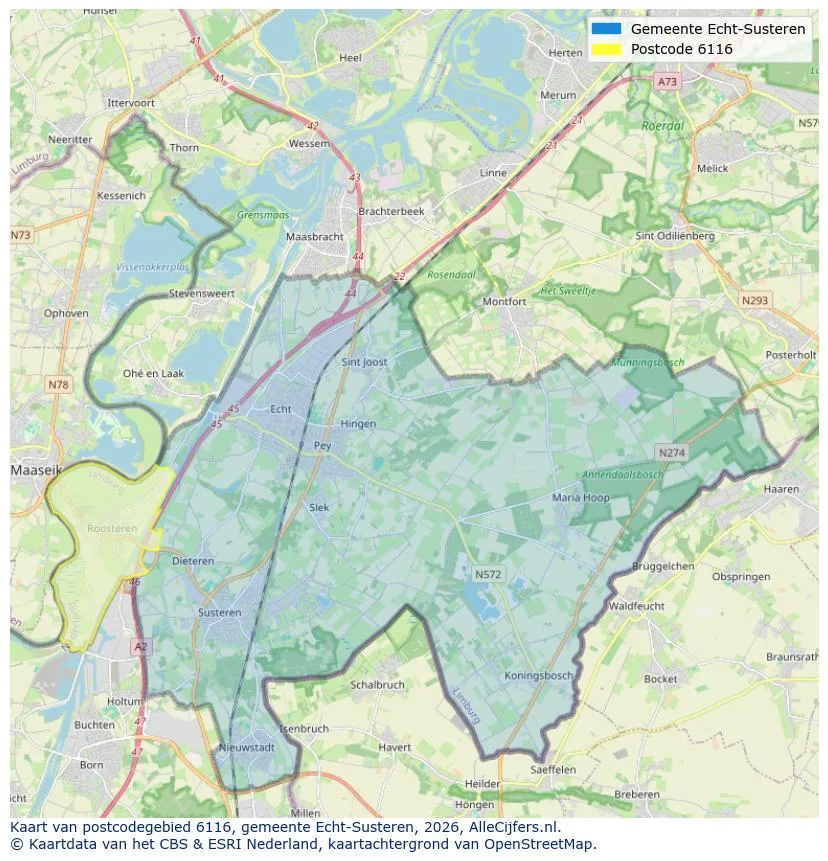
Geographic orientation and real estate agent density in Roosteren
View current location data on residents, WOZ development, housing stock, energy consumption, business activity and safety in Roosteren. In 2025 were there 1.540 residents. The average WOZ value in 2025 is EUR 332.000.
Residents
1.540
Last year: 2025
Average WOZ
EUR 332.000
Last year: 2025
Average income per person.
EUR 33.100
Source: AllNumbers
Crimes (current year)
76
Total registered
| Year | Residents |
|---|---|
| 2021 | 1.425 |
| 2022 | 1.450 |
| 2023 | 1.490 |
| 2024 | 1.495 |
| 2025 | 1.540 |
| Year | Average WOZ |
|---|---|
| 2021 | EUR 254.000 |
| 2022 | EUR 265.000 |
| 2023 | EUR 307.000 |
| 2024 | EUR 304.000 |
| 2025 | EUR 332.000 |
Hoger
330
Praktisch
310
Middelbaar
500
Europa
200
Nederland
1.235
Buiten Europa
95
Label C
186
Label G
137
Label D
119
Label B
100
Label A
73
Label F
71
Label E
24
Label A++
6
Label A+
3
Label A+++
2
Label A++++
1
Label A+++++
0
| Year | Gas (m3) | Electricity (kWh) |
|---|---|---|
| 2020 | 1.640 | 3.430 |
| 2021 | 1.850 | 3.450 |
| 2022 | 1.440 | 3.300 |
| 2023 | 1.120 | 3.100 |
| 2024 | 1.100 | 3.260 |
Hoekwoning
Gas: 1.010 • Electricity: 2.760
Huurwoning
Gas: 920 • Electricity: 2.410
Koopwoning
Gas: 1.200 • Electricity: 3.360
Appartement
Gas: 720 • Electricity: 1.880
Tussenwoning
Gas: 960 • Electricity: 2.670
Vrijstaande woning
Gas: 1.370 • Electricity: 3.760
Twee-onder-één-kap woning
Gas: 1.050 • Electricity: 2.960
Total number of company establishments: 180
| Period | Crimes |
|---|---|
| jan 2025 | 5 |
| jan 2026 | 8 |
| jul 2025 | 5 |
| jun 2025 | 7 |
| mei 2025 | 11 |
| mrt 2025 | 12 |
| nov 2024 | 7 |
| nov 2025 | 3 |
| okt 2024 | 11 |
| okt 2025 | 4 |
| sep 2024 | 8 |
| sep 2025 | 5 |
These figures give an indicative picture of safety trends in the living environment of Roosteren.
Short answers based on current local statistics, handy for a quick comparison of the living environment.
Roosteren telt in 2025 ongeveer 1.540 inwoners.
De gemiddelde WOZ-waarde in Roosteren is in 2025 circa € 332.000.
Het gemiddelde inkomen per inwoner in Roosteren ligt rond € 33.100 per jaar.
Voor het huidige jaar gaat het om ongeveer 76 geregistreerde misdrijven. Gebruik deze cijfers als indicatie en vergelijk trends per periode.
In Roosteren komt vooral "Vrijstaande woningen" veel voor, met ongeveer 249 woningen.
View more homes in this location.

6116AK Roosteren
€ 398.000 k.k.
€ 1.479/m²

6116BR Roosteren
€ 330.000 k.k.
€ 3.055/m²

6116AZ Roosteren
€ 750.000 k.k.
€ 3.348/m²

6116BS Roosteren
€ 375.000 k.k.
€ 3.676/m²

6116CD Roosteren
€ 299.000 k.k.
€ 2.875/m²

6116BV Roosteren
€ 289.000 k.k.
€ 2.651/m²

6116CC Roosteren
€ 348.000 k.k.
€ 3.052/m²

6116BZ Roosteren
€ 215.000 k.k.
€ 2.388/m²
